


signal strength 2 of 5
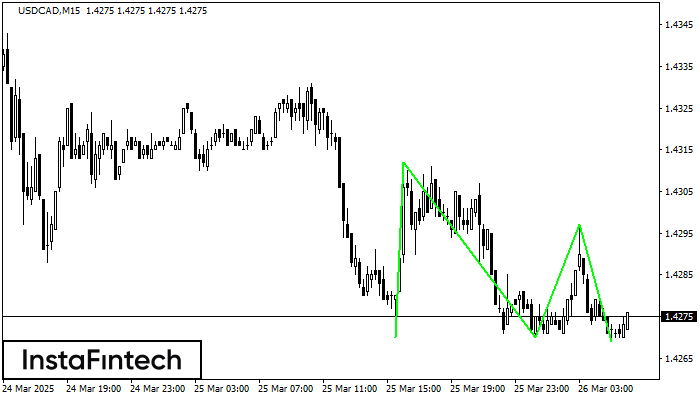
The Triple Bottom pattern has formed on the chart of USDCAD M15. Features of the pattern: The lower line of the pattern has coordinates 1.4312 with the upper limit 1.4312/1.4297, the projection of the width is 42 points. The formation of the Triple Bottom pattern most likely indicates a change in the trend from downward to upward. This means that in the event of a breakdown of the resistance level 1.4270, the price is most likely to continue the upward movement.
The M5 and M15 time frames may have more false entry points.
Xem thêm
- All
- Double Top
- Flag
- Head and Shoulders
- Pennant
- Rectangle
- Triangle
- Triple top
- All
- #AAPL
- #AMZN
- #Bitcoin
- #EBAY
- #FB
- #GOOG
- #INTC
- #KO
- #MA
- #MCD
- #MSFT
- #NTDOY
- #PEP
- #TSLA
- #TWTR
- AUDCAD
- AUDCHF
- AUDJPY
- AUDUSD
- EURCAD
- EURCHF
- EURGBP
- EURJPY
- EURNZD
- EURRUB
- EURUSD
- GBPAUD
- GBPCHF
- GBPJPY
- GBPUSD
- GOLD
- NZDCAD
- NZDCHF
- NZDJPY
- NZDUSD
- SILVER
- USDCAD
- USDCHF
- USDJPY
- USDRUB
- All
- M5
- M15
- M30
- H1
- D1
- All
- Buy
- Sale
- All
- 1
- 2
- 3
- 4
- 5
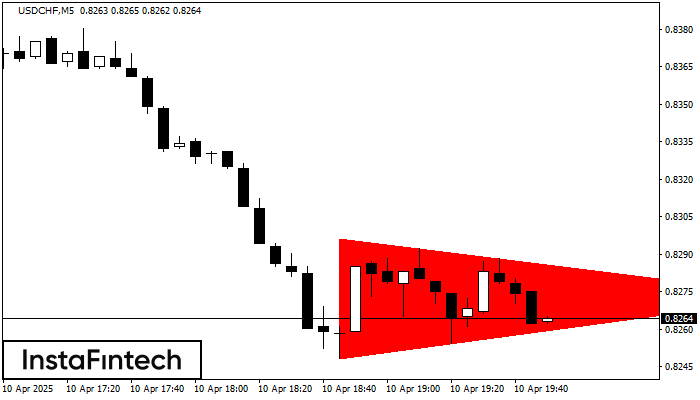
Theo biểu đồ của M5, USDCHF đã hình thành mô hình Tam giác Cân Giảm. Mô tả: Đường biên giới thấp hơn là 0.8248/0.8273 và đường biên giới
Khung thời gian M5 và M15 có thể có nhiều điểm vào lệnh sai hơn.
Open chart in a new window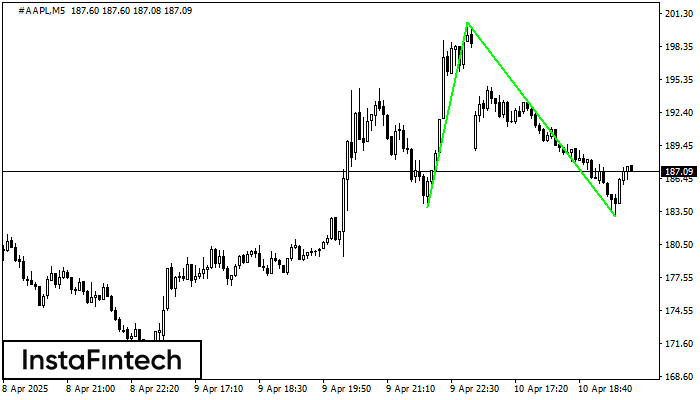
Mô hình Đáy đôi đã được hình thành trên #AAPL M5; đường viền trên là 200.55; đường viền dưới là 183.02. Độ rộng của mô hình là 1666 điểm. Trong
Khung thời gian M5 và M15 có thể có nhiều điểm vào lệnh sai hơn.
Open chart in a new window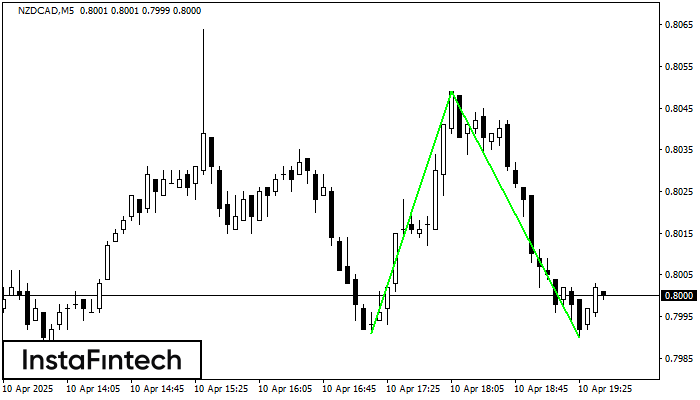
Mô hình Đáy đôi đã được hình thành trên NZDCAD M5. Sự hình thành này báo hiệu sự đảo chiều của xu hướng từ dưới lên trên. Tín hiệu
Khung thời gian M5 và M15 có thể có nhiều điểm vào lệnh sai hơn.
Open chart in a new window


