signal strength 1 of 5
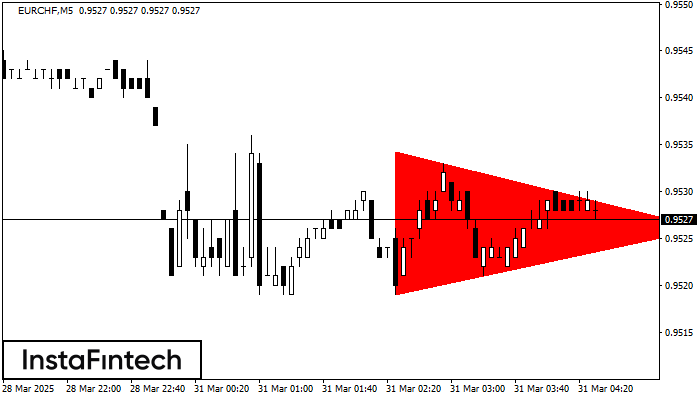
According to the chart of M5, EURCHF formed the Bearish Symmetrical Triangle pattern. Description: The lower border is 0.9519/0.9526 and upper border is 0.9534/0.9526. The pattern width is measured on the chart at -15 pips. The formation of the Bearish Symmetrical Triangle pattern evidently signals a continuation of the downward trend. In other words, if the scenario comes true and EURCHF breaches the lower border, the price could continue its move toward 0.9511.
The M5 and M15 time frames may have more false entry points.
ดูเพิ่มเติม
- All
- Double Top
- Flag
- Head and Shoulders
- Pennant
- Rectangle
- Triangle
- Triple top
- All
- #AAPL
- #AMZN
- #Bitcoin
- #EBAY
- #FB
- #GOOG
- #INTC
- #KO
- #MA
- #MCD
- #MSFT
- #NTDOY
- #PEP
- #TSLA
- #TWTR
- AUDCAD
- AUDCHF
- AUDJPY
- AUDUSD
- EURCAD
- EURCHF
- EURGBP
- EURJPY
- EURNZD
- EURRUB
- EURUSD
- GBPAUD
- GBPCHF
- GBPJPY
- GBPUSD
- GOLD
- NZDCAD
- NZDCHF
- NZDJPY
- NZDUSD
- SILVER
- USDCAD
- USDCHF
- USDJPY
- USDRUB
- All
- M5
- M15
- M30
- H1
- D1
- All
- Buy
- Sale
- All
- 1
- 2
- 3
- 4
- 5
was formed on 23.04 at 19:30:51 (UTC+0)
signal strength 4 of 5

รูปแบบ รูปแบบกราฟธงปลายแหลมขาขึ้น (Bullish pennant) ได้ถูกสร้างขึ้นมาในชาร์ต #NTDOY H1 มันเป็นประเภทของรูปแบบต่อเนื่อง ตามที่คาดไว้ กรณีที่ราคาทรงตัวอยุ่สูงกว่าระดับสูงสุดของกราฟรูปธงปลายแหลมที่ 18.72 ก็อาจจะมีแนวโน้มขาขึ้นต่อไป
Open chart in a new windowwas formed on 23.04 at 19:30:50 (UTC+0)
signal strength 4 of 5
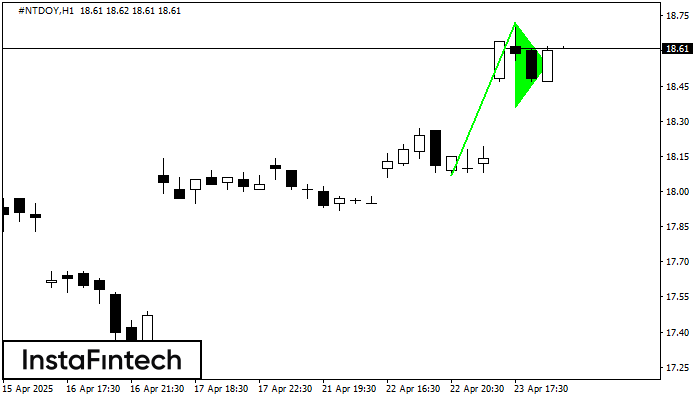
สัญญาณ รูปแบบกราฟธงปลายแหลมขาขึ้น (Bullish pennant) – ตราสารการซื้อขาย #NTDOY H1 เป็นรูปแบบความต่อเนื่อง การคาดการณ์: มันเป็นไปได้ที่จะกำหนดสถานะแบบซื้อ ไว้สูงกว่าระดับสูงสุดของกราฟรูปแบบนี้ใน 18.72 พร้อมกับแนวโน้มที่อาจจะมีการเคลื่อนตัวครั้งต่อไปที่จะกลายมาเป็นระดับสูงของเสาธง
Open chart in a new windowwas formed on 23.04 at 19:30:18 (UTC+0)
signal strength 3 of 5
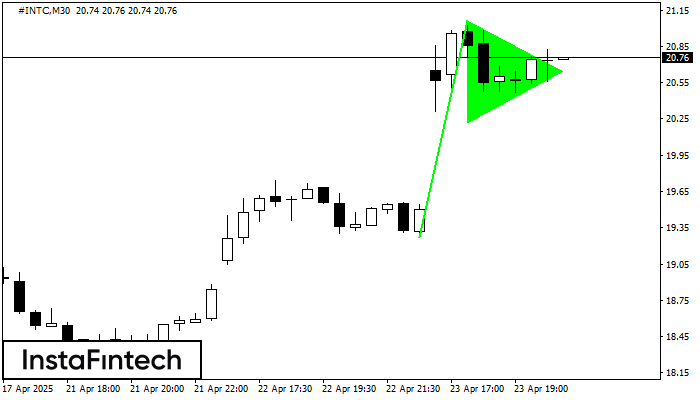
รูปแบบ รูปแบบกราฟธงปลายแหลมขาขึ้น (Bullish pennant) ได้ถูกสร้างขึ้นมาในชาร์ต #INTC M30 มันเป็นประเภทของรูปแบบต่อเนื่อง ตามที่คาดไว้ กรณีที่ราคาทรงตัวอยุ่สูงกว่าระดับสูงสุดของกราฟรูปธงปลายแหลมที่ 21.06 ก็อาจจะมีแนวโน้มขาขึ้นต่อไป
Open chart in a new window