empty
25.07.2020 07:42 PM
Comprehensive analysis of movement options for #USDX vs EUR/USD & GBP/USD & USD/JPY (Daily) on July 27, 2020

Minor operational scale (Daily)

Options for the development of the movement #USDX vs EUR/USD & GBP/USD & USD/JPY - Daily from July 27, 2020.

____________________

US dollar index

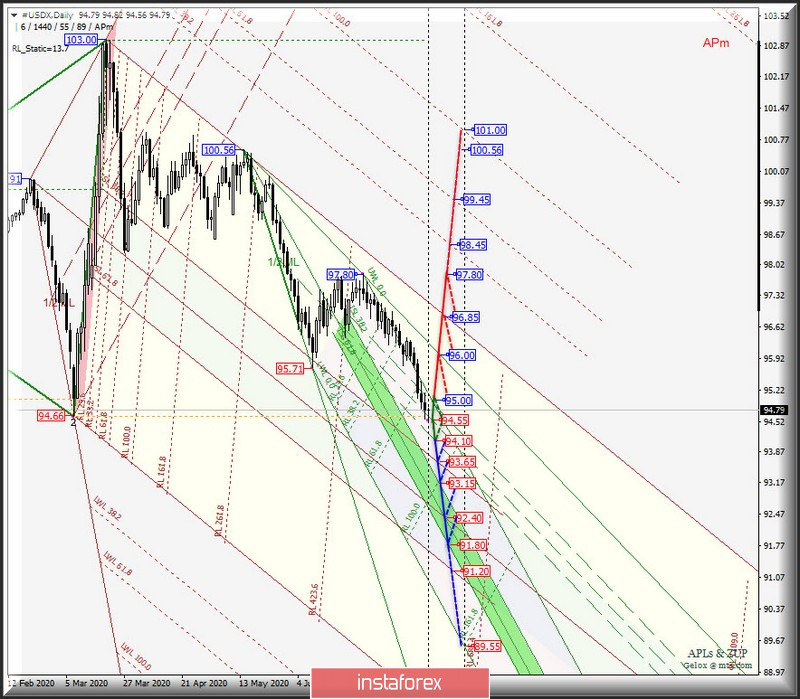
From July 27, 2020, the movement of the dollar index #USDX will be determined by the development and direction of the breakdown of the boundaries of the 1/2 Median Line channel (95.00 - 94.55 - 94.10) of the Minute operational scale forks - we look at the animated chart for details of how these boundaries were worked out.

In the breakdown of the support level at 94.10 on the lower border of the channel 1/2 Median Line of the Minute operational scale fork, the movement of the dollar index will continue to the boundaries of the equilibrium zones of the Minor operational scale fork (93.65 - 92.40 - 91.20) - Minute (93.15 - 92.40 - 91.80).

If the resistance level of 95.00 is broken at the upper border of the channel 1/2 Median Line of the Minute operational scale forks, it will be possible to develop an upward movement #USDX to the goals:

  • UTL control line (96.00) of the Minute operational scale forks;
  • initial SSL line (96.85) of the Minor operational scale forks;
  • local maximum 97.80.

The layout of the #USDX movement options from July 27, 2020 is shown on the animated chart.

This image is no longer relevant

____________________

Euro vs US dollar

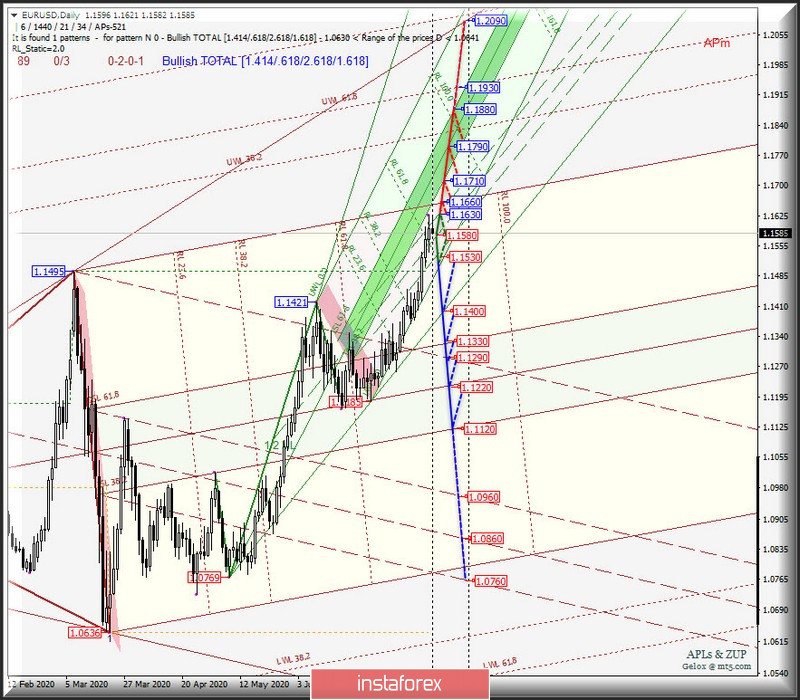
The single European currency EUR/USD from July 27, 2020 will continue to develop its movement depending on the development and direction of the breakdown of the borders of the 1/2 Median Line channel (1.1530 - 1.1580 - 1.1630) of the Minute operational scale forks - details of movement inside the channel 1 / 2ML Minute are shown on the animated graph.

If the resistance level of 1.1630 at the upper border of the channel 1/2 Median Line of the Minute operational scale forks, it will continue development of the upward movement of the single European currency to the target line FSL (1.1660) of the Minor operational scale forks and zone balance (1.1710 - 1.1790 - 1.1880) of the Minute operational scale forks.

In case of a breakdown of the support level of 1.1530 at the lower border of the 1/2 Median Line Minute channel, the EUR/USD downward movement towards the LTL control line (1.1400) of the Minute operational scale forks will become relevant with the prospect of reaching the equilibrium zone boundaries (1.1330 - 1.1220 - 1.1120) of the Minor operational scale forks.

The EUR/USD movement options from July 24, 2020 are shown on the animated chart.

This image is no longer relevant

____________________

Great Britain pound vs US dollar

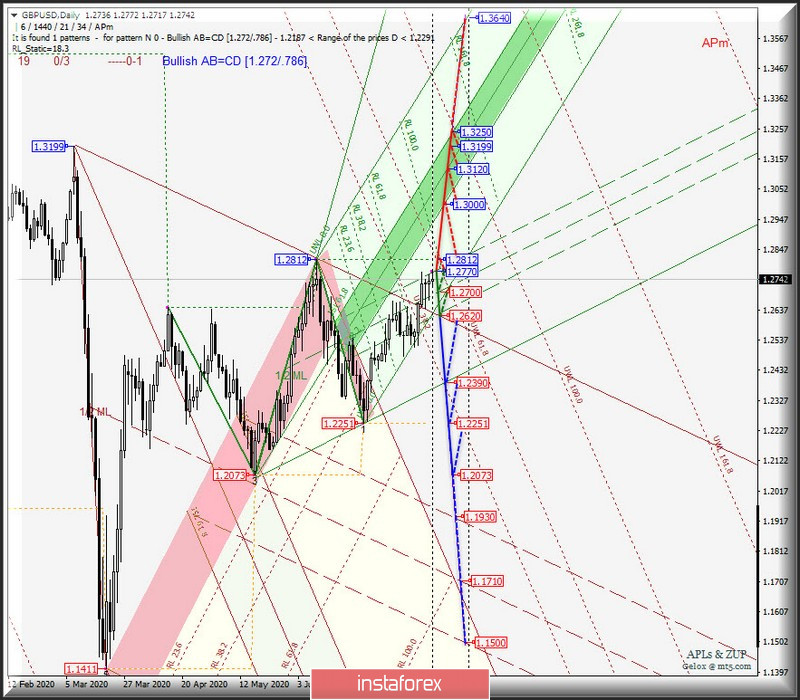
The development of the movement of Her Majesty's currency GBP/USD from July 24, 2020, as well as the previous instruments, will be due to the development and direction of the breakdown of the boundaries of the 1/2 Median Line channel (1.2610 - 1.2700 - 1.2770) of the Minute operational scale forks - details of movement inside this channel are shown on the animated chart.

A breakdown of the resistance level of 1.2770 at the upper border of the channel 1/2 Median Line Minute, followed by an update of the local maximum 1.2812, will determine the continuation of the upward movement of the currency of Her Majesty to the equilibrium zone (1.3000 - 1.3120 - 1.3250) of the Minute operational scale forks.

A breakdown of the support level of 1.2620 at the lower border of the channel 1/2 Median Line Minute will direct the movement of GBP/USD to the control line LTL (1.2390) of the Minute operational scale forks with the prospect of updating the local minimum 1.2251 - 1.2073.

We look at the options for the movement of GBP/USD from July 6, 2020 on an animated chart.

This image is no longer relevant

____________________

US dollar vs Japanese yen

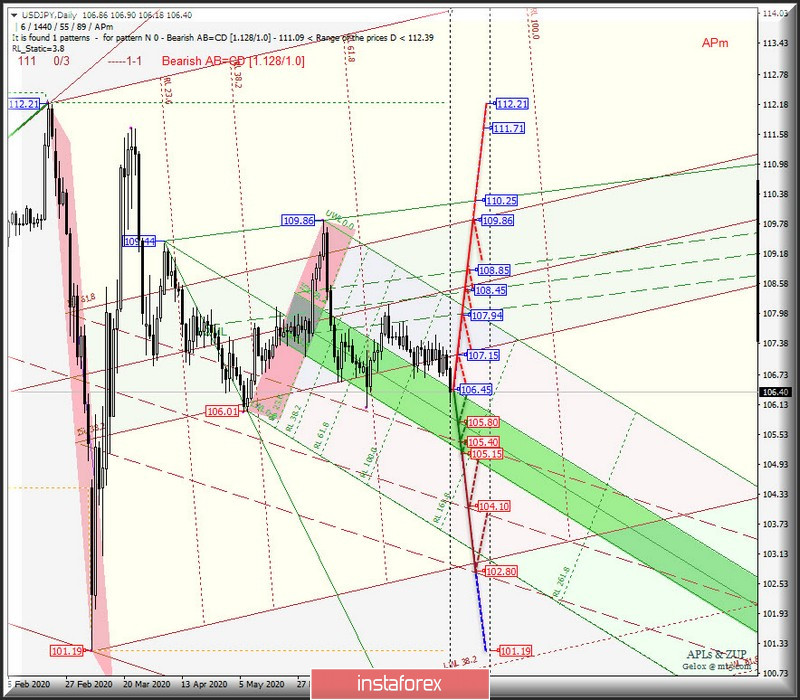
The development of the movement of the currency of the "Land of the Rising Sun" USD/JPY from July 27, 2020 will be due to the development and direction of the breakdown of the boundaries of the equilibrium zone (106.45 - 105.80 - 105.15) of the Minute operational scale forks - the movement markings within this equilibrium zone are shown in the animated graphics.

A breakout of the lower border ISL61.8 zone equilibrium of the Minute operational scale forks confirm the further development of the movement of the currency "Land of the Rising Sun" in the channel 1/2 Median Line (105.40 - 104.10 - 102.80) of the Minor operational scale forks.

If the resistance level of 106.45 is broken at the upper border of the ISL38.2 equilibrium zone, it will be possible to reach the USD/JPY boundaries of the equilibrium zone (107.13 - 108.45 - 109.86) of the Minor operational scale forks and channel 1/2 Median Line (107.94 - 108.45 - 108.85) of the Minute operational scale forks.

The marking of USD/JPY movement options since July 27, 2020 is shown on the animated chart.

This image is no longer relevant

____________________

The review is compiled without taking into account the news background, the opening of trading sessions of the main financial centers and is not a guide to action (placing "sell" or "buy" orders).

Formula for calculating the dollar index:

USDX = 50.14348112 * USDEUR0.576 * USDJPY0.136 * USDGBP0.119 * USDCAD0.091 * USDSEK0.042 * USDCHF0.036.

Where the power coefficients correspond to the weights of currencies in the basket:

Euro - 57.6 %;

Yen - 13.6 %;

Pound sterling - 11.9 %;

Canadian dollar - 9.1 %;

Swedish Krona - 4.2 %;

Swiss franc - 3.6 %.

The first coefficient in the formula brings the index value to 100 on the starting date - March 1973, when the main currencies began to be freely quoted relative to each other.

Ratu Taslim,
ผู้เชี่ยวชาญด้านการวิเคราะห์ของ InstaForex
© 2007-2025
เลือกช่วงเวลา
5
นาที
15
นาที
30
นาที
1
ชั่วโมง
4
ชั่วโมง
1
วัน
1
สัปดาห์
รับผลกำไรจากการเปลี่ยนแปลงอัตราสกุลเงินดิจิทัลกับ InstaForex.
ดาวน์โหลด MetaTrader 4 และเปิดการซื้อขายครั้งแรกของคุณ.
USD/CAD: คู่สกุลเงินมีการรวมตัวท่ามกลางแรงกดดัน ค่าเงิน USD/CAD แสดงการเคลื่อนไหวในแนวด้านข้าง โดยราคาในขณะนี้อยู่ที่ระดับประมาณ 1.3840 บาท การลดลงของราคาน้ำมันดิบสู่ระดับต่ำสุดในรอบสามสัปดาห์ท่ามกลางความกังวลว่าการเกิดสงครามการค้าเต็มรูปแบบอาจทำให้เกิดภาวะเศรษฐกิจถดถอยทั่วโลกและลดความต้องการเชื้อเพลิงนั้นส่งผลเสียต่อค่าเงินแคนาดา เนื่องจากเศรษฐกิจของแคนาดาพึ่งพาการส่งออกน้ำมันอย่างมาก การเพิ่มการจัดส่งจาก OPEC+ อาจทำให้สถานการณ์แย่ลงไปกว่าเดิมด้วยการลดความต้องการ เนื่องจากสมาชิก OPEC+ หลายรายได้ประกาศว่าพวกเขาจะเร่งเพิ่มการผลิตเป็นเดือนที่สองติดต่อกันในเดือนมิถุนายน นอกจากนี้
  • Grand Choice
    Contest by
    InstaForex
    InstaForex always strives to help you
    fulfill your biggest dreams.
    เข้าร่วมการแข่งขัน


บทความแนะนำ

การพยากรณ์ Forex 29/04/2025: EUR/USD, GBP/USD, ทองคำ, Ethereum และ Bitcoin

ลิงก์ที่มีประโยชน์: บทความอื่นๆ ของฉันสามารถอ่านได้ในส่วนนี้ คอร์ส InstaForex สำหรับผู้เริ่มต้น การวิเคราะห์ยอดนิยม เปิดบัญชีซื้อขาย สำคัญ: ผู้เริ่มต้นในตลาดซื้อขาย Forex ต้องระมัดระวังอย่างมากในการตัดสินใจที่จะเข้าสู่ตลาด ก่อนการเปิดเผยรายงานสำคัญ ควรหลีกเลี่ยงการซื้อขายในตลาดเพื่อป้องกันตัวเองจากความผันผวนที่รุนแรงของตลาดอันเนื่องมาจากการเพิ่มขึ้นของความผันผวน หากคุณตัดสินใจที่จะทำการซื้อขายในช่วงที่มีการเผยแพร่ข่าว

Sebastian Seliga 08:41 2025-04-30 UTC+2

การวิเคราะห์ทางเทคนิคของการเคลื่อนไหวราคาภายในวันของคู่สกุลเงิน AUD/JPY วันพุธที่ 30 เมษายน 2025

เมื่อปรากฏรูปแบบ Divergent และ Descending Broadening Wedge บนกราฟแท่งเทียน 4 ชั่วโมงของคู่สกุลเงิน AUD/JPY แม้ว่าการเคลื่อนไหวของราคาจะต่ำกว่าค่าเฉลี่ย EMA (21) ซึ่งมีแนวโน้มที่ลดลง แต่ข้อมูลทั้งสองนี้เป็นสัญญาณว่าในอนาคตอันใกล้นี้

Arief Makmur 06:19 2025-04-30 UTC+2

การวิเคราะห์ทางเทคนิคของการเคลื่อนไหวราคารายวันของคู่เงินหลัก USD/JPY, วันพุธที่ 30 เมษายน 2025

ในกราฟเวลา 4 ชั่วโมงของคู่สกุลเงินหลัก USD/JPY สามารถสังเกตเห็นได้ว่า ตัวชี้วัด Stochastic Oscillator ได้สร้างรูปแบบ Double Bottom ขึ้นมา ในขณะที่การเคลื่อนไหวของราคา USD/JPY

Arief Makmur 06:17 2025-04-30 UTC+2

สัญญาณการซื้อขายสำหรับ GOLD (XAU/USD) สำหรับวันที่ 29-30 เมษายน 2025: ซื้อเมื่อราคาสูงกว่า $3,310 (21 SMA - 7/8 Murray)

ในช่วงต้นของการซื้อขายในตลาดอเมริกา ราคาทองคำกำลังซื้อขายอยู่ที่ระดับประมาณ 3,310 ซึ่งตั้งอยู่ที่ 21SMA และอยู่ภายในรูปแบบสามเหลี่ยมสมมาตรที่เกิดขึ้นเมื่อวันที่ 23 เมษายน การรวมราคาน่าจะเกิดขึ้นในอีกไม่กี่วันข้างหน้าในขณะที่รอการประกาศที่สำคัญ สำหรับข่าวนี้ ประธานาธิบดีสหรัฐฯ จะประกาศมาตรการอัตราภาษีสำหรับรถยนต์ มีข่าวลือในตลาดว่า Trump จะผ่อนปรนมาตรการภาษีรถยนต์ซึ่งจะทำให้ความต้องการทองคำลดลง

Dimitrios Zappas 18:10 2025-04-29 UTC+2

สัญญาณการซื้อขาย EUR/USD สำหรับวันที่ 29-30 เมษายน 2025: ขายเมื่อราคาต่ำกว่า 1.1410 (สามเหลี่ยมสมมาตร - 7/8 Murray)

ในช่วงต้นของเซสชันอเมริกัน คู่เงิน EUR/USD มีการซื้อขายอยู่ใกล้ระดับ 1.1393 ภายในรูปแบบสามเหลี่ยมสมมาตรที่เกิดขึ้นตั้งแต่วันที่ 22 เมษายน ยูโรแสดงสัญญาณการปรับฐาน แต่ยังมีการสังเกตว่ามีการเหนื่อยล้าของแรงขาขึ้น ซึ่งเราคิดว่ายูโรอาจมีการปรับฐานทางเทคนิคในอีกไม่กี่ชั่วโมงข้างหน้า หากยูโรสามารถลดลงต่ำกว่ารูปแบบสามเหลี่ยมสมมาตรและสามารถปรับฐานต่ำกว่า 1.1370 มันจะถูกมองว่าเป็นโอกาสในการขายโดยมีเป้าหมายที่ 6/8

Dimitrios Zappas 17:52 2025-04-29 UTC+2

การพยากรณ์ตลาด Forex วันที่ 28/04/2025: EUR/USD, GBP/USD, USD/JPY, USDX, ทองคำ และ Bitcoin

ลิงก์ที่เป็นประโยชน์: สามารถอ่านบทความอื่น ๆ ของฉันได้ในส่วนนี้ หลักสูตร InstaForex สำหรับผู้เริ่มต้น การวิเคราะห์ที่ได้รับความนิยม เปิดบัญชีซื้อขาย ข้อควรระวัง: นักเทรดฟอเร็กซ์มือใหม่ต้องระมัดระวังอย่างมากเมื่อทำการตัดสินใจเข้าตลาด ก่อนการประกาศรายงานสำคัญ แนะนำให้หลีกเลี่ยงการเข้าเทรดในตลาดเพื่อหลีกเลี่ยงความผันผวนที่เกิดขึ้นจากตลาดที่มีความผันผวนสูง หากคุณตัดสินใจที่จะเทรดในระหว่างการประกาศข่าว ควรวางคำสั่งหยุดขาดทุนเสมอเพื่อจำกัดการสูญเสีย

Sebastian Seliga 18:34 2025-04-28 UTC+2

สัญญาณการเทรดสำหรับ EUR/USD สำหรับวันที่ 28-30 เมษายน 2025: ขายต่ำกว่า 1.1370 (21 SMA - 7/8 Murray)

ในช่วงเช้าของการซื้อขายในสหรัฐอเมริกา ยูโรซื้อขายอยู่ที่ประมาณ 1.1349 ในแชนแนลของแนวโน้มที่ลดลงซึ่งก่อตั้งขึ้นเมื่อวันที่ 18 เมษายน EUR/USD มีการรวมตัวกันในช่วงไม่กี่วันที่ผ่านมาอยู่ที่ประมาณ 1.1340 หากคู่ EUR/USD ทะลุและรวมตัวที่เหนือแชนแนลของแนวโน้มที่ลดลง และที่ระดับสูงกว่า 21SMA ที่ตั้งอยู่ที่

Dimitrios Zappas 16:29 2025-04-28 UTC+2

สัญญาณการซื้อขายสำหรับทองคำ (XAU/USD) วันที่ 28-30 เมษายน 2025: ซื้อเหนือระดับ $3,270 (21 SMA - 7/8 Murray)

ในช่วงต้นของการซื้อขายในฝั่งอเมริกา ราคาทองคำเคลื่อนไหวอยู่ราว ๆ 3,299 ภายในช่องแนวโน้มที่ลดลงซึ่งเริ่มก่อตัวตั้งแต่วันที่ 21 เมษายน แสดงถึงการฟื้นตัวเหนือแนวรับที่ 3,270 ที่กราฟ H4 เราสามารถเห็นการรวมตัวของราคา $100 จาก 3,370

Dimitrios Zappas 16:25 2025-04-28 UTC+2

บทวิเคราะห์ทางเทคนิค – GOLD

เมื่อสัปดาห์ที่แล้ว ฝ่ายซื้อได้ปรับค่าจุดสูงสุดทางประวัติศาสตร์และสร้างค่าจุดสุดขีดใหม่ที่ 3499.58 หลังจากนั้น ทองคำได้เข้าสู่การปรับฐานลงไปในแนวสนับสนุนของแนวโน้มระยะสั้นประจำวันที่ 3346.45 ตลาดได้หยุดชะงัก หากความรู้สึกของฝ่ายขายได้รับแรงกระตุ้นใหม่เพื่อพัฒนาต่อไป เป้าหมายถัดไปจะเป็นแนวโน้มระยะกลางประจำวันที่ 3227.79 และการปรับฐานลงอาจขยายไปยังแนวสนับสนุนของแนวโน้มระยะสั้นรายสัปดาห์ที่ 3164.81 การกำจัดจุดไขว้สีทองประจำวันที่ 3163.64 และการยืนต่ำกว่าแนวรายสัปดาห์ที่

Evangelos Poulakis 06:49 2025-04-28 UTC+2

USD/JPY – สรุปและแนวโน้ม

สัปดาห์ที่แล้ว ตลาดได้ปรับปรุงระดับต่ำสุดใหม่ แต่ผู้ขายไม่สามารถทำให้การเคลื่อนไหวลงต่อไปได้อย่างเต็มที่ อาจเป็นเพราะระดับต่ำสุดของสัปดาห์ก่อนหน้านี้ (141.63) ได้รับการสนับสนุนเพิ่มเติมจากระดับสนับสนุนรายเดือน (141.96) ส่งผลให้การลดลงหยุดชะงัก และคู่สกุลเงินนี้เริ่มมีการปรับตัวขึ้น ในการปรับตัวขึ้นนี้ ฝ่ายซื้อสามารถกลับมาเรียกคืนการสนับสนุนจากแนวโน้มระยะสั้นในกรอบรายวัน ซึ่งปัจจุบันตั้งอยู่ที่ 141.97 และยังคงดันราคาขึ้นเรื่อยๆ เป้าหมายที่ใกล้ในตอนนี้

Evangelos Poulakis 03:51 2025-04-28 UTC+2
หากไม่สะดวกคุยในตอนนี้
ระบุคำถามไว้ได้ใน แชท.
Widget callback
 

Dear visitor,

Your IP address shows that you are currently located in the USA. If you are a resident of the United States, you are prohibited from using the services of InstaFintech Group including online trading, online transfers, deposit/withdrawal of funds, etc.

If you think you are seeing this message by mistake and your location is not the US, kindly proceed to the website. Otherwise, you must leave the website in order to comply with government restrictions.

Why does your IP address show your location as the USA?

  • - you are using a VPN provided by a hosting company based in the United States;
  • - your IP does not have proper WHOIS records;
  • - an error occurred in the WHOIS geolocation database.

Please confirm whether you are a US resident or not by clicking the relevant button below. If you choose the wrong option, being a US resident, you will not be able to open an account with InstaForex anyway.

We are sorry for any inconvenience caused by this message.