signal strength 1 of 5
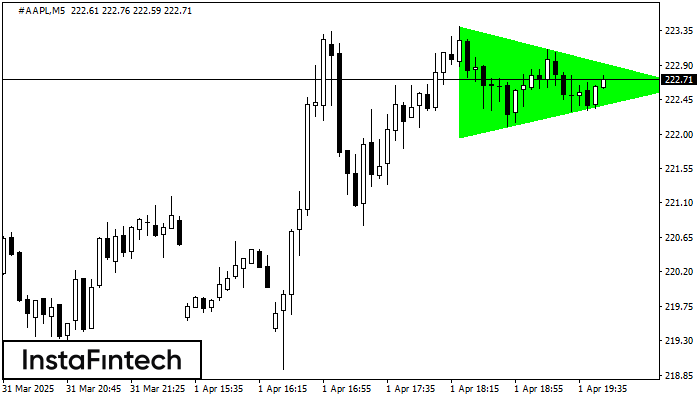
According to the chart of M5, #AAPL formed the Bullish Symmetrical Triangle pattern. The lower border of the pattern touches the coordinates 221.96/222.64 whereas the upper border goes across 223.40/222.64. If the Bullish Symmetrical Triangle pattern is in progress, this evidently signals a further upward trend. In other words, in case the scenario comes true, the price of #AAPL will breach the upper border to head for 222.79.
The M5 and M15 time frames may have more false entry points.
See Also
- All
- Double Top
- Flag
- Head and Shoulders
- Pennant
- Rectangle
- Triangle
- Triple top
- All
- #AAPL
- #AMZN
- #Bitcoin
- #EBAY
- #FB
- #GOOG
- #INTC
- #KO
- #MA
- #MCD
- #MSFT
- #NTDOY
- #PEP
- #TSLA
- #TWTR
- AUDCAD
- AUDCHF
- AUDJPY
- AUDUSD
- EURCAD
- EURCHF
- EURGBP
- EURJPY
- EURNZD
- EURRUB
- EURUSD
- GBPAUD
- GBPCHF
- GBPJPY
- GBPUSD
- GOLD
- NZDCAD
- NZDCHF
- NZDJPY
- NZDUSD
- SILVER
- USDCAD
- USDCHF
- USDJPY
- USDRUB
- All
- M5
- M15
- M30
- H1
- D1
- All
- Buy
- Sale
- All
- 1
- 2
- 3
- 4
- 5
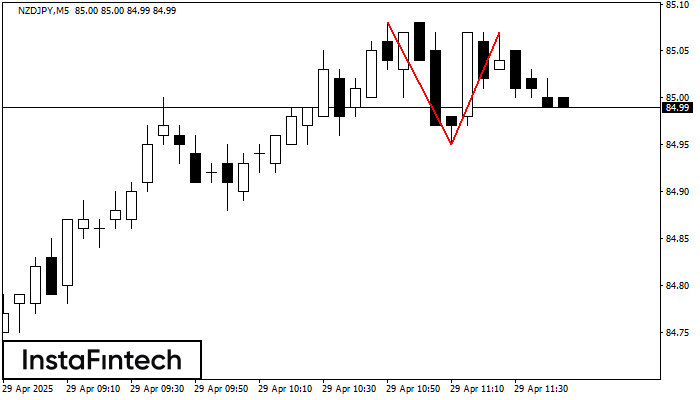
On the chart of NZDJPY M5 the Double Top reversal pattern has been formed. Characteristics: the upper boundary 85.07; the lower boundary 84.95; the width of the pattern 12 points
The M5 and M15 time frames may have more false entry points.
Open chart in a new window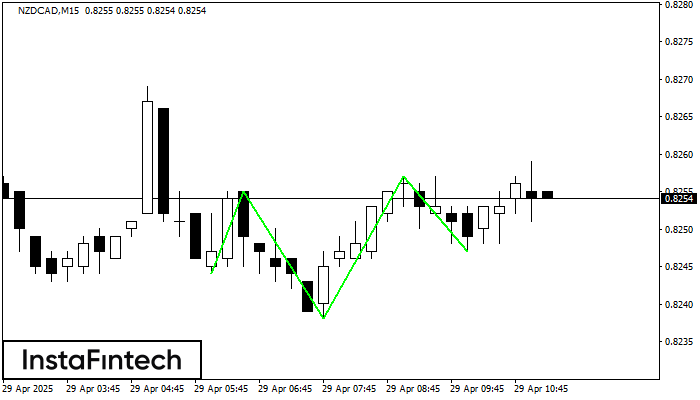
According to the chart of M15, NZDCAD formed the Inverse Head and Shoulder pattern. The Head’s top is set at 0.8257 while the median line of the Neck is found
The M5 and M15 time frames may have more false entry points.
Open chart in a new window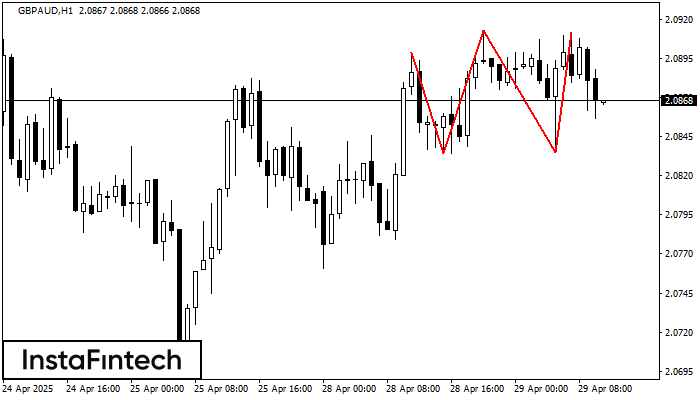
The Triple Top pattern has formed on the chart of the GBPAUD H1 trading instrument. It is a reversal pattern featuring the following characteristics: resistance level -13, support level -1
Open chart in a new window