empty
сформирован 31.03 в 04:00:43 (UTC+0)
сила сигнала 2 из 5
Тройная вершина EURCAD M15

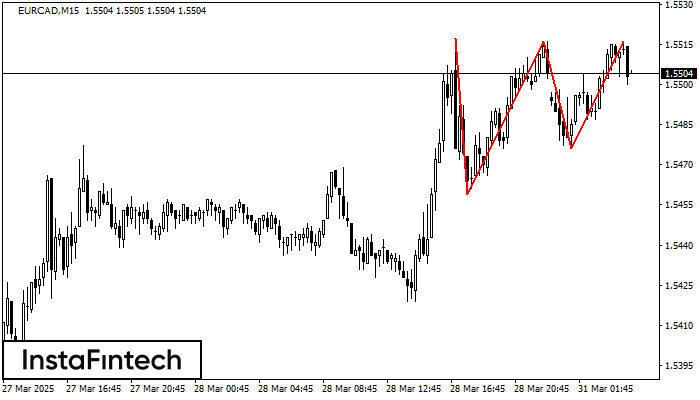
По EURCAD на M15 сформировалась фигура «Тройная вершина». Характеристика: Границы имеют восходящий угол. Нижняя граница фигуры имеет координаты 1.5459/1.5476, при этом верхняя граница 1.5517/1.5516. Проекция ширины 58 пунктов. Формирование фигуры «Тройная вершина» наиболее вероятным образом свидетельствует об изменении тренда с восходящего на нисходящий. Это означает, что, в случае пробоя нижней границы 1.5476, курс, с наибольшей вероятностью, продолжит нисходящее движение.

Таймфреймы М5 и М15 могут иметь больше ложных точек входа.

Смотрите также

Фигура
  • Все
  • Вымпел
  • Голова и плечи
  • Двойная вершина
  • Прямоугольник
  • Треугольник
  • Тройная вершина
  • Флаг
Инструмент
  • Все
  • #AAPL
  • #AMZN
  • #Bitcoin
  • #EBAY
  • #FB
  • #GOOG
  • #INTC
  • #KO
  • #MA
  • #MCD
  • #MSFT
  • #NTDOY
  • #PEP
  • #TSLA
  • #TWTR
  • AUDCAD
  • AUDCHF
  • AUDJPY
  • AUDUSD
  • EURCAD
  • EURCHF
  • EURGBP
  • EURJPY
  • EURNZD
  • EURRUB
  • EURUSD
  • GBPAUD
  • GBPCHF
  • GBPJPY
  • GBPUSD
  • GOLD
  • NZDCAD
  • NZDCHF
  • NZDJPY
  • NZDUSD
  • SILVER
  • USDCAD
  • USDCHF
  • USDJPY
  • USDRUB
Таймфрейм
  • Все
  • M5
  • M15
  • M30
  • H1
  • D1
Тренд
  • Все
  • Покупка
  • Продажа
Сила сигнала
  • Все
  • 1
  • 2
  • 3
  • 4
  • 5
Bearish Symmetrical Triangle
was formed on 29.04 at 11:24:40 (UTC+0)
signal strength 2 of 5
Bearish Symmetrical Triangle AUDCHF M15

According to the chart of M15, AUDCHF formed the Bearish Symmetrical Triangle pattern. Trading recommendations: A breach of the lower border 0.5271 is likely to encourage a continuation

The M5 and M15 time frames may have more false entry points.

Open chart in a new window
Triple Top
was formed on 29.04 at 11:20:00 (UTC+0)
signal strength 1 of 5
Triple Top NZDJPY M5

The Triple Top pattern has formed on the chart of the NZDJPY M5. Features of the pattern: borders have an ascending angle; the lower line of the pattern

The M5 and M15 time frames may have more false entry points.

Open chart in a new window
Bullish Rectangle
was formed on 29.04 at 11:09:55 (UTC+0)
signal strength 1 of 5
Bullish Rectangle SILVER M5

According to the chart of M5, SILVER formed the Bullish Rectangle which is a pattern of a trend continuation. The pattern is contained within the following borders: the lower border

The M5 and M15 time frames may have more false entry points.

Open chart in a new window
Сейчас не можете говорить по телефону?
Задайте Ваш вопрос в чате.
Обратный звонок
 

Dear visitor,

Your IP address shows that you are currently located in the USA. If you are a resident of the United States, you are prohibited from using the services of InstaFintech Group including online trading, online transfers, deposit/withdrawal of funds, etc.

If you think you are seeing this message by mistake and your location is not the US, kindly proceed to the website. Otherwise, you must leave the website in order to comply with government restrictions.

Why does your IP address show your location as the USA?

  • - you are using a VPN provided by a hosting company based in the United States;
  • - your IP does not have proper WHOIS records;
  • - an error occurred in the WHOIS geolocation database.

Please confirm whether you are a US resident or not by clicking the relevant button below. If you choose the wrong option, being a US resident, you will not be able to open an account with InstaForex anyway.

We are sorry for any inconvenience caused by this message.