сила сигнала 1 из 5
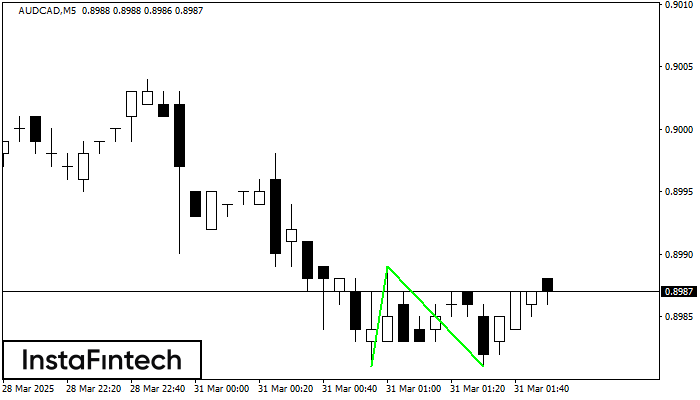
Сформирована фигура «Двойное дно» на графике AUDCAD M5. Данное формирование сигнализирует об изменении тенденции с нисходящего на восходящее движение. Сигнал: Торговую позицию на покупку следует открывать после пробоя верхней границы фигуры 0.8989, где перспектива будущего хода будет являться шириной текущей фигуры - 8 пунктов.
Таймфреймы М5 и М15 могут иметь больше ложных точек входа.
Смотрите также
- Все
- Вымпел
- Голова и плечи
- Двойная вершина
- Прямоугольник
- Треугольник
- Тройная вершина
- Флаг
- Все
- #AAPL
- #AMZN
- #Bitcoin
- #EBAY
- #FB
- #GOOG
- #INTC
- #KO
- #MA
- #MCD
- #MSFT
- #NTDOY
- #PEP
- #TSLA
- #TWTR
- AUDCAD
- AUDCHF
- AUDJPY
- AUDUSD
- EURCAD
- EURCHF
- EURGBP
- EURJPY
- EURNZD
- EURRUB
- EURUSD
- GBPAUD
- GBPCHF
- GBPJPY
- GBPUSD
- GOLD
- NZDCAD
- NZDCHF
- NZDJPY
- NZDUSD
- SILVER
- USDCAD
- USDCHF
- USDJPY
- USDRUB
- Все
- M5
- M15
- M30
- H1
- D1
- Все
- Покупка
- Продажа
- Все
- 1
- 2
- 3
- 4
- 5

On the chart of NZDCAD D1 the Double Top reversal pattern has been formed. Characteristics: the upper boundary 0.8316; the lower boundary 0.7826; the width of the pattern 490 points
Открыть график инструмента в новом окне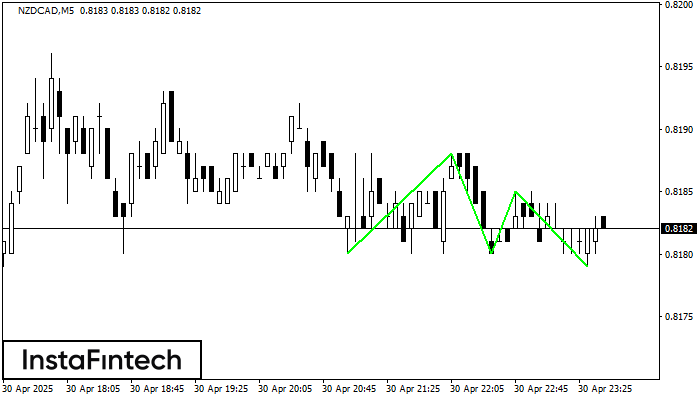
The Triple Bottom pattern has been formed on NZDCAD M5. It has the following characteristics: resistance level 0.8188/0.8185; support level 0.8180/0.8179; the width is 8 points. In the event
The M5 and M15 time frames may have more false entry points.
Открыть график инструмента в новом окне
According to the chart of M15, #Bitcoin formed the Bullish Symmetrical Triangle pattern. The lower border of the pattern touches the coordinates 92482.78/94081.93 whereas the upper border goes across 95186.64/94081.93
The M5 and M15 time frames may have more false entry points.
Открыть график инструмента в новом окне