signal strength 1 of 5
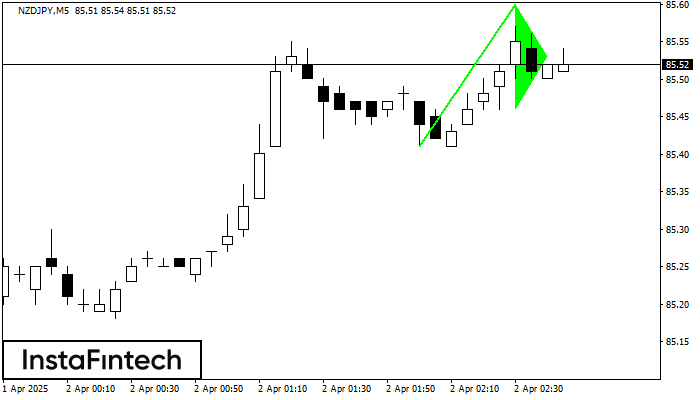
The Bullish pennant signal – Trading instrument NZDJPY M5, continuation pattern. Forecast: it is possible to set up a buy position above the pattern’s high of 85.60, with the prospect of the next move being a projection of the flagpole height.
The M5 and M15 time frames may have more false entry points.
See Also
- All
- Double Top
- Flag
- Head and Shoulders
- Pennant
- Rectangle
- Triangle
- Triple top
- All
- #AAPL
- #AMZN
- #Bitcoin
- #EBAY
- #FB
- #GOOG
- #INTC
- #KO
- #MA
- #MCD
- #MSFT
- #NTDOY
- #PEP
- #TSLA
- #TWTR
- AUDCAD
- AUDCHF
- AUDJPY
- AUDUSD
- EURCAD
- EURCHF
- EURGBP
- EURJPY
- EURNZD
- EURRUB
- EURUSD
- GBPAUD
- GBPCHF
- GBPJPY
- GBPUSD
- GOLD
- NZDCAD
- NZDCHF
- NZDJPY
- NZDUSD
- SILVER
- USDCAD
- USDCHF
- USDJPY
- USDRUB
- All
- M5
- M15
- M30
- H1
- D1
- All
- Buy
- Sale
- All
- 1
- 2
- 3
- 4
- 5
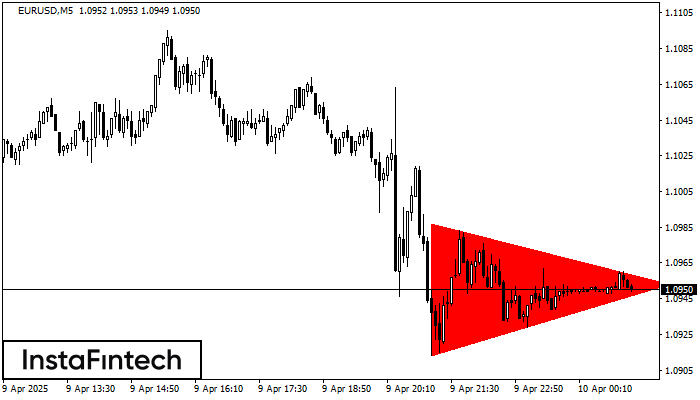
Según el gráfico de M5, el EURUSD formó el patrón Triángulo Simétrico Bajista. Descripción: El límite inferior es 1.0913/1.0953 y el límite superior es 1.0987/1.0953. El ancho del patrón
Los marcos de tiempo M5 y M15 pueden tener más puntos de entrada falsos.
Open chart in a new window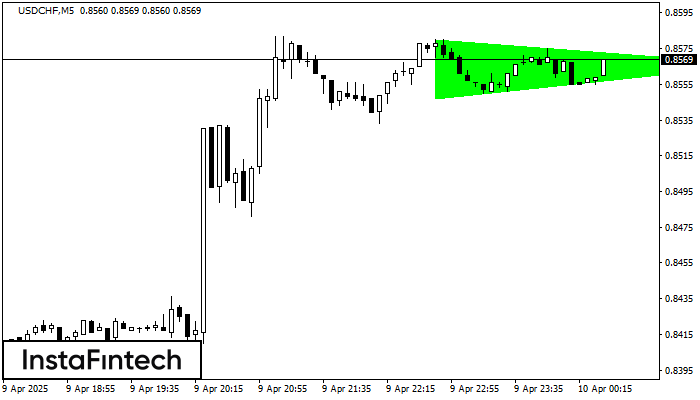
Según el gráfico de M5, USDCHF formó el patrón Triángulo Simétrico Alcista. Descripción: Este es el patrón de la continuación de una tendencia. 0.8580 y 0.8547 son las coordenadas
Los marcos de tiempo M5 y M15 pueden tener más puntos de entrada falsos.
Open chart in a new window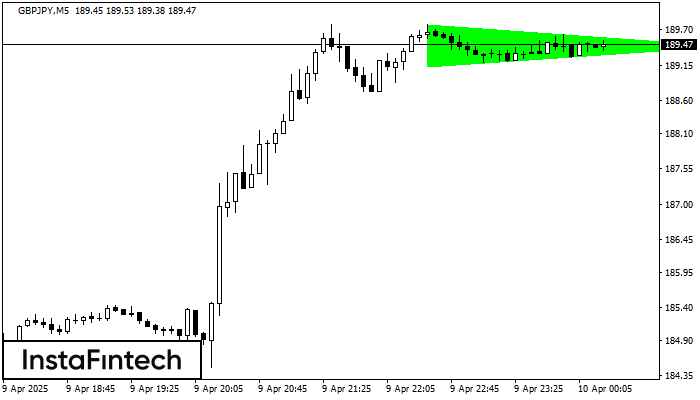
Según el gráfico de M5, el GBPJPY formó el patrón Triángulo Simétrico Alcista. El límite inferior del patrón toca las coordenadas 189.13/189.44 donde el límite superior cruza 189.79/189.44
Los marcos de tiempo M5 y M15 pueden tener más puntos de entrada falsos.
Open chart in a new window