signal strength 1 of 5
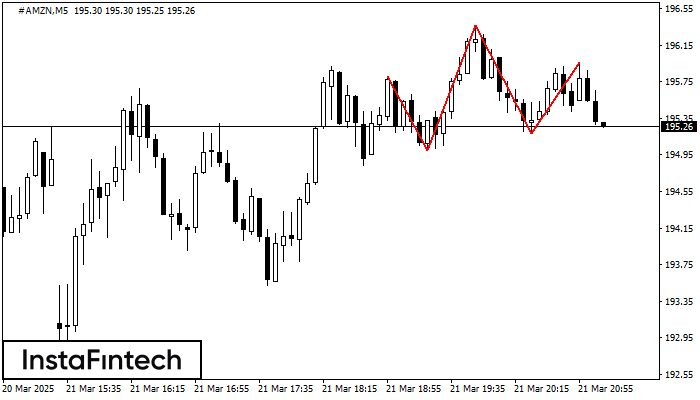
According to the chart of M5, #AMZN formed the Head and Shoulders pattern. The Head’s top is set at 196.36 while the median line of the Neck is found at 195.00/195.18. The formation of the Head and Shoulders pattern evidently signals a reversal of the upward trend. In other words, in case the scenario comes true, the price of #AMZN will go towards 195.03.
The M5 and M15 time frames may have more false entry points.
See Also
- All
- Double Top
- Flag
- Head and Shoulders
- Pennant
- Rectangle
- Triangle
- Triple top
- All
- #AAPL
- #AMZN
- #Bitcoin
- #EBAY
- #FB
- #GOOG
- #INTC
- #KO
- #MA
- #MCD
- #MSFT
- #NTDOY
- #PEP
- #TSLA
- #TWTR
- AUDCAD
- AUDCHF
- AUDJPY
- AUDUSD
- EURCAD
- EURCHF
- EURGBP
- EURJPY
- EURNZD
- EURRUB
- EURUSD
- GBPAUD
- GBPCHF
- GBPJPY
- GBPUSD
- GOLD
- NZDCAD
- NZDCHF
- NZDJPY
- NZDUSD
- SILVER
- USDCAD
- USDCHF
- USDJPY
- USDRUB
- All
- M5
- M15
- M30
- H1
- D1
- All
- Buy
- Sale
- All
- 1
- 2
- 3
- 4
- 5
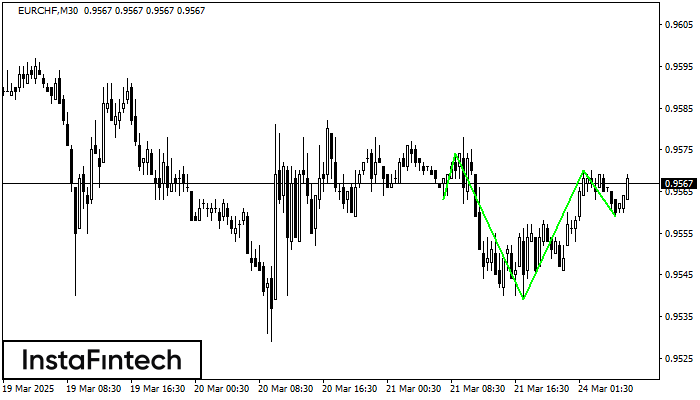
Según el gráfico de M30, EURCHF produjo el patrón llamado el Cabeza y Hombros Inverso. La Cabeza está establecida en 0.9539 mientras la línea media del Cuello se encuentra
Open chart in a new window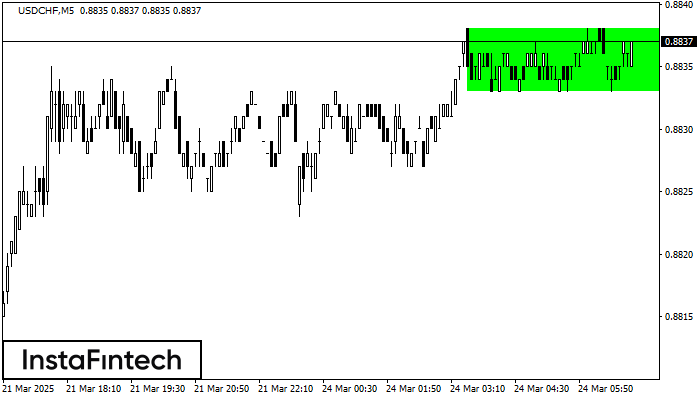
Según el gráfico de M5, USDCHF formó el Rectángulo Alcista. Este tipo de patrón indica la continuación de una tendencia. Esto consiste de dos niveles: resistencia 0.8838 y soporte 0.8833
Los marcos de tiempo M5 y M15 pueden tener más puntos de entrada falsos.
Open chart in a new window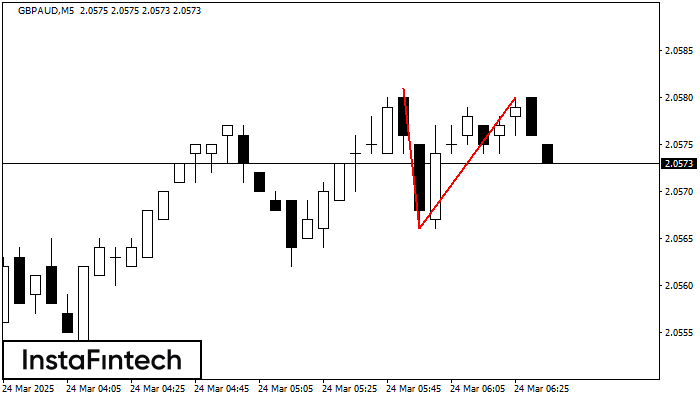
El patrón Doble Techo ha sido formado en GBPAUD M5. Esto señala que la tendencia ha sido cambiada de alcista a bajista. Probablemente, si la base del patrón 2.0566
Los marcos de tiempo M5 y M15 pueden tener más puntos de entrada falsos.
Open chart in a new window