signal strength 1 of 5
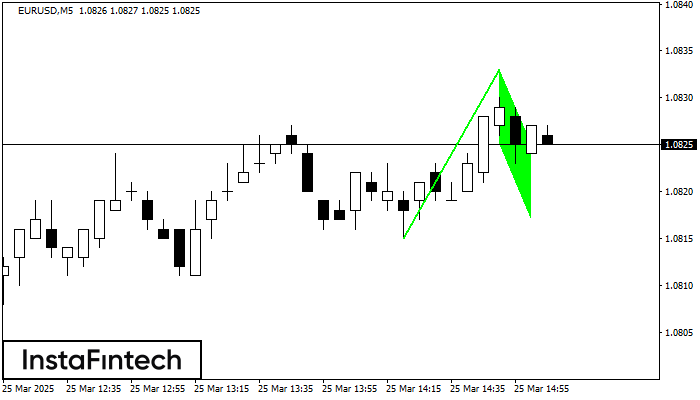
The Bullish Flag pattern has been formed on EURUSD at M5. The lower boundary of the pattern is located at 1.0825/1.0817, while the higher boundary lies at 1.0833/1.0825. The projection of the flagpole is 18 points. This formation signals that the upward trend is most likely to continue. Therefore, if the level of 1.0833 is broken, the price will move further upwards.
The M5 and M15 time frames may have more false entry points.
Veja também
- All
- Double Top
- Flag
- Head and Shoulders
- Pennant
- Rectangle
- Triangle
- Triple top
- All
- #AAPL
- #AMZN
- #Bitcoin
- #EBAY
- #FB
- #GOOG
- #INTC
- #KO
- #MA
- #MCD
- #MSFT
- #NTDOY
- #PEP
- #TSLA
- #TWTR
- AUDCAD
- AUDCHF
- AUDJPY
- AUDUSD
- EURCAD
- EURCHF
- EURGBP
- EURJPY
- EURNZD
- EURRUB
- EURUSD
- GBPAUD
- GBPCHF
- GBPJPY
- GBPUSD
- GOLD
- NZDCAD
- NZDCHF
- NZDJPY
- NZDUSD
- SILVER
- USDCAD
- USDCHF
- USDJPY
- USDRUB
- All
- M5
- M15
- M30
- H1
- D1
- All
- Buy
- Sale
- All
- 1
- 2
- 3
- 4
- 5

O padrão Fundo duplo foi formado em #Bitcoin M30. Características: o nível de suporte 83552.05; o nível de resistência 84588.82; a largura do padrão 103677 pontos. Se o nível
Open chart in a new window
O padrão Fundo duplo foi formado em #Bitcoin M5. Características: o nível de suporte 83619.16; o nível de resistência 83858.95; a largura do padrão 23979 pontos. Se o nível
Os intervalos M5 e M15 podem ter mais pontos de entrada falsos.
Open chart in a new window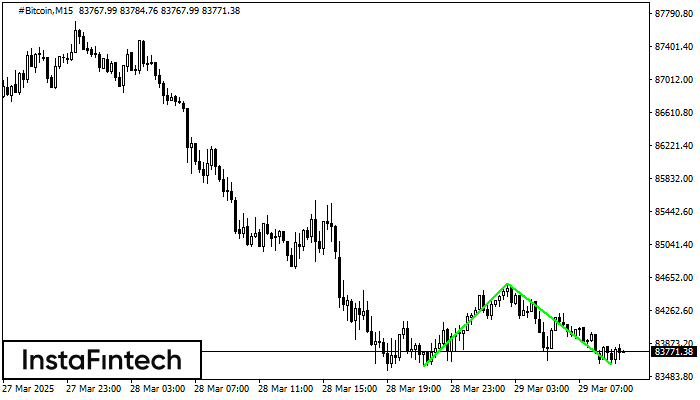
O padrão Fundo duplo foi formado em #Bitcoin M15. Esta formação sinaliza uma reversão da tendência de baixo para cima. O sinal é que uma negociação de compra deve
Os intervalos M5 e M15 podem ter mais pontos de entrada falsos.
Open chart in a new window