signal strength 1 of 5

According to the chart of M5, #GOOG formed the Bullish Symmetrical Triangle pattern, which signals the trend will continue. Description. The upper border of the pattern touches the coordinates 165.68/165.13 whereas the lower border goes across 164.59/165.13. The pattern width is measured on the chart at 109 pips. If the Bullish Symmetrical Triangle pattern is in progress during the upward trend, this indicates the current trend will go on. In case 165.13 is broken, the price could continue its move toward 165.28.
The M5 and M15 time frames may have more false entry points.
See Also
- All
- Double Top
- Flag
- Head and Shoulders
- Pennant
- Rectangle
- Triangle
- Triple top
- All
- #AAPL
- #AMZN
- #Bitcoin
- #EBAY
- #FB
- #GOOG
- #INTC
- #KO
- #MA
- #MCD
- #MSFT
- #NTDOY
- #PEP
- #TSLA
- #TWTR
- AUDCAD
- AUDCHF
- AUDJPY
- AUDUSD
- EURCAD
- EURCHF
- EURGBP
- EURJPY
- EURNZD
- EURRUB
- EURUSD
- GBPAUD
- GBPCHF
- GBPJPY
- GBPUSD
- GOLD
- NZDCAD
- NZDCHF
- NZDJPY
- NZDUSD
- SILVER
- USDCAD
- USDCHF
- USDJPY
- USDRUB
- All
- M5
- M15
- M30
- H1
- D1
- All
- Buy
- Sale
- All
- 1
- 2
- 3
- 4
- 5
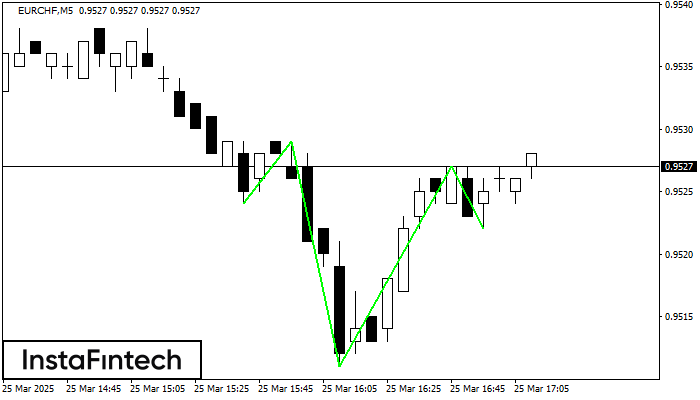
According to the chart of M5, EURCHF produced the pattern termed the Inverse Head and Shoulder. The Head is fixed at 0.9511 while the median line of the Neck
The M5 and M15 time frames may have more false entry points.
Open chart in a new window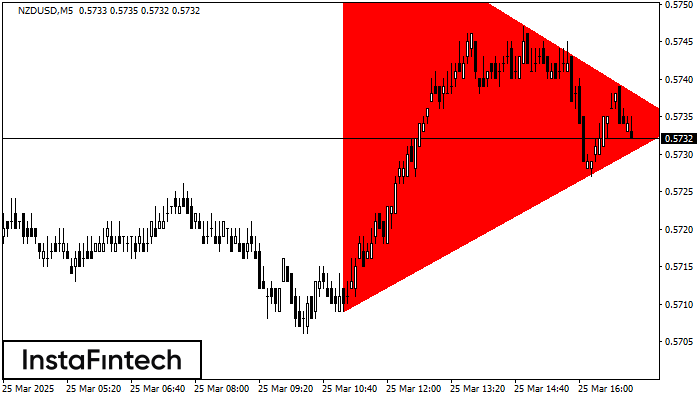
According to the chart of M5, NZDUSD formed the Bearish Symmetrical Triangle pattern. Trading recommendations: A breach of the lower border 0.5709 is likely to encourage a continuation
The M5 and M15 time frames may have more false entry points.
Open chart in a new window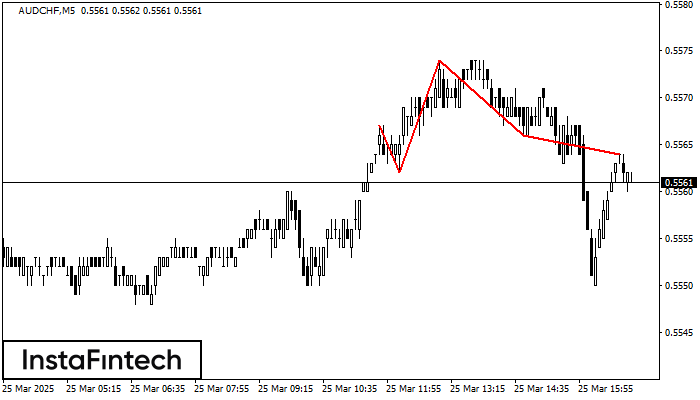
The technical pattern called Head and Shoulders has appeared on the chart of AUDCHF M5. There are weighty reasons to suggest that the price will surpass the Neckline 0.5562/0.5566 after
The M5 and M15 time frames may have more false entry points.
Open chart in a new window