signal strength 1 of 5
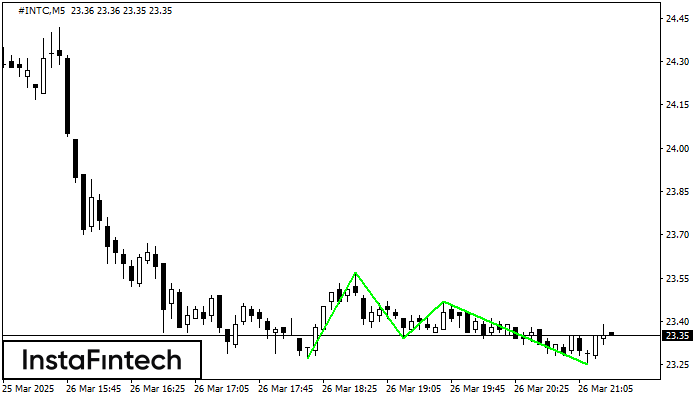
The Triple Bottom pattern has formed on the chart of #INTC M5. Features of the pattern: The lower line of the pattern has coordinates 23.57 with the upper limit 23.57/23.47, the projection of the width is 30 points. The formation of the Triple Bottom pattern most likely indicates a change in the trend from downward to upward. This means that in the event of a breakdown of the resistance level 23.27, the price is most likely to continue the upward movement.
The M5 and M15 time frames may have more false entry points.
یہ بھی دیکھیں
- All
- Double Top
- Flag
- Head and Shoulders
- Pennant
- Rectangle
- Triangle
- Triple top
- All
- #AAPL
- #AMZN
- #Bitcoin
- #EBAY
- #FB
- #GOOG
- #INTC
- #KO
- #MA
- #MCD
- #MSFT
- #NTDOY
- #PEP
- #TSLA
- #TWTR
- AUDCAD
- AUDCHF
- AUDJPY
- AUDUSD
- EURCAD
- EURCHF
- EURGBP
- EURJPY
- EURNZD
- EURRUB
- EURUSD
- GBPAUD
- GBPCHF
- GBPJPY
- GBPUSD
- GOLD
- NZDCAD
- NZDCHF
- NZDJPY
- NZDUSD
- SILVER
- USDCAD
- USDCHF
- USDJPY
- USDRUB
- All
- M5
- M15
- M30
- H1
- D1
- All
- Buy
- Sale
- All
- 1
- 2
- 3
- 4
- 5

Pada carta #KO H1 corak pembalikan Double Top telah terbentuk. Ciri-ciri: sempadan atas 72.67; sempadan bawah 71.72; lebar corak 95 mata. Isyarat: penembusan sempadan bawah akan menyebabkan kesinambungan arah aliran
Open chart in a new window
Pada carta instrumen dagangan #MA H1, corak Triple Top yang menandakan perubahan aliran telah terbentuk. Adalah mungkin bahawa selepas pembentukan bahagian atas ketiga, harga akan cuba menembusi tahap rintangan 508.17
Open chart in a new window
Corak Triple Top telah dibentuk pada carta #MA M30. Ciri corak: sempadan mempunyai sudut menaik; garisan bawah corak mempunyai koordinat 508.17/512.83 dengan had atas 523.81/521.51; unjuran lebar ialah 1564 mata
Open chart in a new window