empty
23.01.2025 11:29 AM
S&P 500 at peak, with bear market signals emerging

This image is no longer relevant

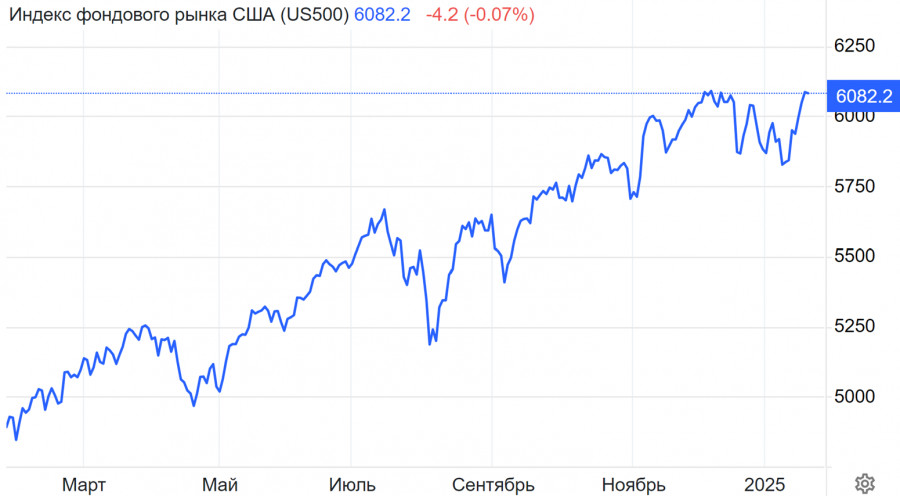
Futures on US equities remained almost unchanged on Thursday following a strong rally in the previous session that saw the S&P 500 index hit a new all-time high. However, this comes as no surprise to market participants. Such a strong rally can be attributed to a robust earnings season as well as optimism surrounding deregulation and tax cuts under the Trump administration. These factors continue to support bullish sentiment.

Fundamental background

Netflix soared nearly 10% after reporting record subscriber growth, confirming strong demand for digital content and the ongoing trend toward digital consumption.

Procter & Gamble gained 1.9% after the company posted strong quarterly results, indicating sustained demand for consumer goods, even amidst rising competition.

Oracle surged by 6.8% after announcing a $500 billion AI joint venture with SoftBank and OpenAI, boosting market confidence in the long-term potential of AI.

Macroeconomic expectations

Investors remain optimistic about further tax cuts and deregulation, expecting additional economic acceleration.

Labor market data, particularly initial jobless claims, continues to be closely watched as it provides insight into employment conditions and indirectly affects consumer spending.

Technical analysis

The S&P 500 recently broke through the resistance levels of 6,000 and 6,060, accelerating the ongoing intermediate upside momentum that began in early January.

Given the sustained bullish trend and overall positive market sentiment, the next target appears to be around 6,110, where a short-term pullback is possible.

If buying momentum remains strong, the next areas of interest will be 6,200 and then 6,400–6,500. However, according to wave structure analysis, the range of 6,400–6,500 could mark the start of a more significant correction or even a shift into a long-term bearish phase.

This image is no longer relevant

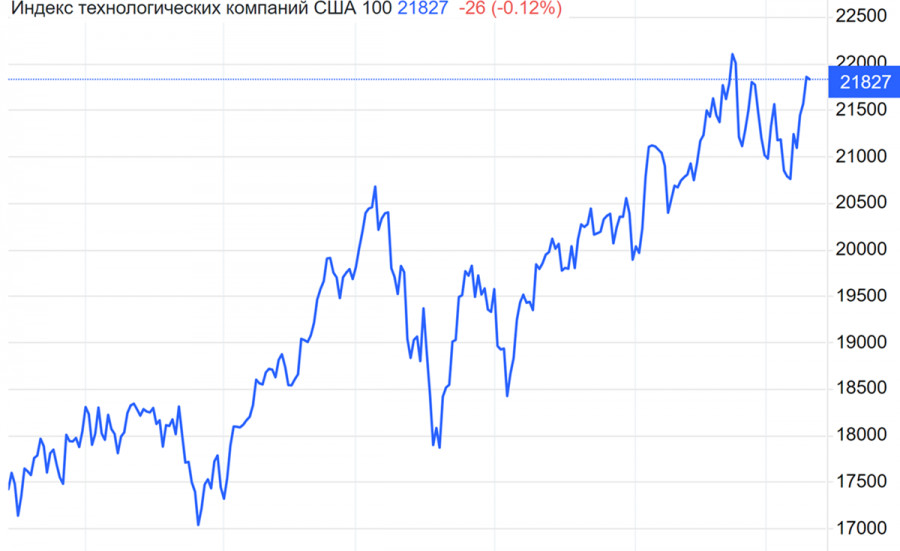
The Nasdaq Composite closed at 21,820 on Wednesday, adding 286 points, or 1.33%.

Over the past four weeks, the Nasdaq has seen a modest rise (+0.10%), which could signal some consolidation after previous gains.

The annual growth of 24% reflects a strong trend over the past 12 months. However, forecasts for the end of the quarter (20,615) and the end of next year (19,355) suggest the possibility of a correction phase.

From a wave theory perspective, the market may be nearing the final stage of a major upward wave, making it crucial for investors to monitor the index's reaction as it approaches key psychological levels.

This image is no longer relevant

Conclusion for traders and investors

Short-term outlook:The S&P 500 and Nasdaq remain in a bullish trend, supported by positive earnings reports and expectations of stimulus measures. Traders could consider buying on corrections to support levels if their strategy involves short-term trend trading.

Medium-term and long-term outlook:If the S&P 500 reaches the key resistance levels of 6,200–6,500, and the Nasdaq potentially falls to 20,600–19,350, it may be time to reassess portfolios. Adding to short positions or locking in profits could be a sensible strategy if a downward correction begins.

Risks

  • Potential overvaluation of high-tech companies (growth in market capitalization not always supported by fundamental metrics).
  • Uncertainty surrounding the implementation of political promises regarding deregulation and tax incentives.
  • Potential geopolitical factors that could trigger increased volatility in the short term.

For investors focused on longer time horizons, it is essential to stay attuned to key macro and microeconomic indicators, as strong resistance levels and overheating in certain market sectors could trigger significant corrections.

For day traders and those focused on shorter timeframes, it may make sense to continue trading with the trend, but as soon as there are signs of weakening momentum, it is crucial to shift to more conservative positions or use stop-loss orders.

Natalya Andreeva,
انسٹافاریکس کا تجزیاتی ماہر
© 2007-2025
ٹائم فریم منتخب کریں
5
منٹ
15
منٹ
30
منٹ
1
گھنٹہ
4
گھنٹے
1
دن
1
ہفتہ
انسٹافاریکس کے ساتھ کرپٹو کرنسی کی معاملاتی تبدیلیوں سے کمائیں۔
میٹا ٹریڈر 4 ڈاؤن لوڈ کریں اور اپنی پہلی ٹریڈ کھولیں۔
  • Grand Choice
    Contest by
    InstaForex
    InstaForex always strives to help you
    fulfill your biggest dreams.
    مقابلہ میں شامل ہوں

تجویز کردہ مضامین

یورو / یو ایس ڈی : تجزیہ اور پیشن گوئی

یورو / یو ایس ڈی پئیر مسلسل دوسرے دن مثبت رفتار حاصل کرنے کی کوشش کر رہا ہے، ستمبر میں آخری مرتبہ دیکھی گئی ماہانہ اعلی سطح سے حالیہ واپسی

Irina Yanina 20:17 2025-04-08 UTC+2

تیل اور گیس: تجارتی جنگیں اور ڈومینو اثر

تیل اور گیس کی مارکیٹ نے خود کو ایک نئی تجارتی جنگ کے مرکز میں پایا ہے، جہاں معاشی مفادات اور سیاسی عزائم آپس میں ٹکرا رہے ہیں۔ شہ سرخیوں

Anna Zotova 18:52 2025-04-07 UTC+2

یورو / یو ایس ڈی: ابتدائی تاجروں کے لیے آسان تجارتی تجاویز - 4 اپریل (امریکی سیشن)

یورو کے لیے تجارتی تجزیہ اور سفارشات یہ کہ 1.1050 کی قیمت کا امتحان ایک ایسے وقت میں ہوا جب ایم اے سی ڈی اشارے پہلے ہی صفر کی لکیر

Jakub Novak 21:08 2025-04-04 UTC+2

جی بی پی / یو ایس ڈی: ابتدائی تاجروں کے لیے آسان تجارتی تجاویز - 4 اپریل (یو ایس سیشن)

برطانوی پاؤنڈ کے لیے تجارتی جائزہ اور سفارشات یہ کہ 1.3077 کی قیمت کا امتحان ایسے وقت میں ہوا جب ایم اے سی ڈی اشارے پہلے ہی صفر کی لکیر

Jakub Novak 21:02 2025-04-04 UTC+2

یورو / جے پی وائے: ابتدائی تاجروں کے لیے آسان تجارتی تجاویز - 4 اپریل (امریکی سیشن)

جاپانی ین کے لیے تجارتی جائزہ اور سفارشات یہ کہ 146.16 کی قیمت کا ٹیسٹ ایک ایسے لمحے میں ہوا جب ایم اے سی ڈی انڈیکیٹر پہلے

Jakub Novak 20:47 2025-04-04 UTC+2

ایکس اے یو / یو ایس ڈی : تجزیہ اور پیشن گوئی

سونے کو $3,116 کی سطح کے قریب سپورٹ مل رہی ہے، جو کہ ایک نئی ہمہ وقتی بلندی تک پہنچنے کے بعد اپنے انٹرا

Irina Yanina 18:27 2025-04-03 UTC+2

جی بی پی / یو ایس ڈی تجزیہ اور پیشن گوئی

آج، جی بی پی / یو ایس ڈی پئیر مضبوط ترقی دکھا رہا ہے، جو اکتوبر 2024 میں آخری مرتبہ دیکھی گئی سطح تک پہنچ رہا ہے۔ یہ امریکی ڈالر

Irina Yanina 16:39 2025-04-03 UTC+2

یو ایس ڈی / سی اے ڈی : تجزیہ اور پیشن گوئی

آج، یو ایس ڈی / سی اے ڈی پئیر اپنی سابقہ تنزلی کو روکنے کی کوشش کر رہا ہے، 1.4300 کی سطح سے اوپر لنگر انداز ہونے کی کوشش

Irina Yanina 13:33 2025-04-02 UTC+2

امریکی ڈالر/جاپانی ین: 1 اپریل کو نئے تاجروں کے لیے آسان تجارتی تجاویز - کل کے فاریکس ٹریڈز کا جائزہ

جاپانی ین کے لیے تجارتی جائزہ اور تجارتی تجاویز 149.55 کی سطح کا امتحان ایک ایسے وقت میں ہوا جب MACD اشارے پہلے ہی صفر کی لکیر سے نمایاں

Jakub Novak 11:43 2025-04-01 UTC+2

یورو/امریکی ڈالر: نئے تاجروں کے لیے آسان تجارتی تجاویز - اپریل 1

تجارتی جائزہ اور یورو تجارتی مشورہ 1.0810 کی سطح کا امتحان اس وقت ہوا جب MACD اشارے صفر کے نشان سے نیچے جانا شروع ہوا، جس سے یورو کی فروخت

Jakub Novak 11:31 2025-04-01 UTC+2
ابھی فوری بات نہیں کرسکتے ؟
اپنا سوال پوچھیں بذریعہ چیٹ.
Widget callback
 

Dear visitor,

Your IP address shows that you are currently located in the USA. If you are a resident of the United States, you are prohibited from using the services of InstaFintech Group including online trading, online transfers, deposit/withdrawal of funds, etc.

If you think you are seeing this message by mistake and your location is not the US, kindly proceed to the website. Otherwise, you must leave the website in order to comply with government restrictions.

Why does your IP address show your location as the USA?

  • - you are using a VPN provided by a hosting company based in the United States;
  • - your IP does not have proper WHOIS records;
  • - an error occurred in the WHOIS geolocation database.

Please confirm whether you are a US resident or not by clicking the relevant button below. If you choose the wrong option, being a US resident, you will not be able to open an account with InstaForex anyway.

We are sorry for any inconvenience caused by this message.