signal strength 3 of 5

The Bearish Flag pattern has been formed on EURJPY at M30. The lower boundary of the pattern is located at 162.05/162.27 while the upper boundary lies at 162.33/162.55. The projection of the flagpole is 88 points. This formation signals that the downward trend is most likely to continue. Therefore, if the level of 162.05 is broken, the price will move further downwards.
See Also
- All
- Double Top
- Flag
- Head and Shoulders
- Pennant
- Rectangle
- Triangle
- Triple top
- All
- #AAPL
- #AMZN
- #Bitcoin
- #EBAY
- #FB
- #GOOG
- #INTC
- #KO
- #MA
- #MCD
- #MSFT
- #NTDOY
- #PEP
- #TSLA
- #TWTR
- AUDCAD
- AUDCHF
- AUDJPY
- AUDUSD
- EURCAD
- EURCHF
- EURGBP
- EURJPY
- EURNZD
- EURRUB
- EURUSD
- GBPAUD
- GBPCHF
- GBPJPY
- GBPUSD
- GOLD
- NZDCAD
- NZDCHF
- NZDJPY
- NZDUSD
- SILVER
- USDCAD
- USDCHF
- USDJPY
- USDRUB
- All
- M5
- M15
- M30
- H1
- D1
- All
- Buy
- Sale
- All
- 1
- 2
- 3
- 4
- 5
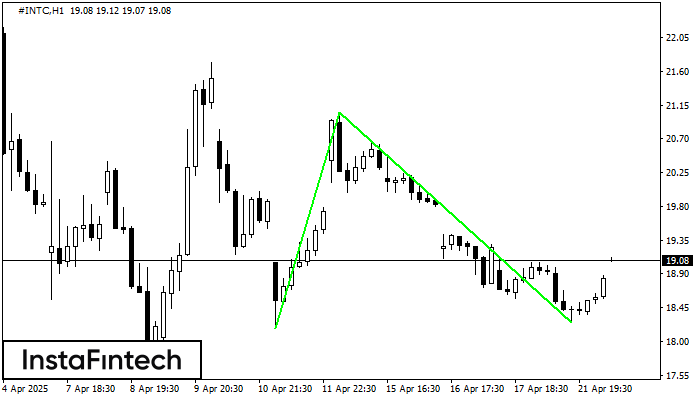
The Double Bottom pattern has been formed on #INTC H1; the upper boundary is 21.05; the lower boundary is 18.25. The width of the pattern is 287 points. In case
Open chart in a new window
The Double Bottom pattern has been formed on NZDCHF M5; the upper boundary is 0.4874; the lower boundary is 0.4857. The width of the pattern is 17 points. In case
The M5 and M15 time frames may have more false entry points.
Open chart in a new window
The Double Bottom pattern has been formed on GBPJPY M5. Characteristics: the support level 187.44; the resistance level 187.65; the width of the pattern 21 points. If the resistance level
The M5 and M15 time frames may have more false entry points.
Open chart in a new window