signal strength 1 of 5

The NZDJPY M5 formed the Head and Shoulders pattern with the following features: The Head’s top is at 85.95, the Neckline and the upward angle are at 85.69/85.68. The formation of this pattern can bring about changes in the current trend from bullish to bearish. In case the pattern triggers the expected changes, the price of NZDJPY will go towards 85.53.
The M5 and M15 time frames may have more false entry points.
See Also
- All
- Double Top
- Flag
- Head and Shoulders
- Pennant
- Rectangle
- Triangle
- Triple top
- All
- #AAPL
- #AMZN
- #Bitcoin
- #EBAY
- #FB
- #GOOG
- #INTC
- #KO
- #MA
- #MCD
- #MSFT
- #NTDOY
- #PEP
- #TSLA
- #TWTR
- AUDCAD
- AUDCHF
- AUDJPY
- AUDUSD
- EURCAD
- EURCHF
- EURGBP
- EURJPY
- EURNZD
- EURRUB
- EURUSD
- GBPAUD
- GBPCHF
- GBPJPY
- GBPUSD
- GOLD
- NZDCAD
- NZDCHF
- NZDJPY
- NZDUSD
- SILVER
- USDCAD
- USDCHF
- USDJPY
- USDRUB
- All
- M5
- M15
- M30
- H1
- D1
- All
- Buy
- Sale
- All
- 1
- 2
- 3
- 4
- 5

According to the chart of M30, NZDJPY formed the Bearish Symmetrical Triangle pattern. Description: The lower border is 83.98/84.43 and upper border is 84.90/84.43. The pattern width is measured
Open chart in a new window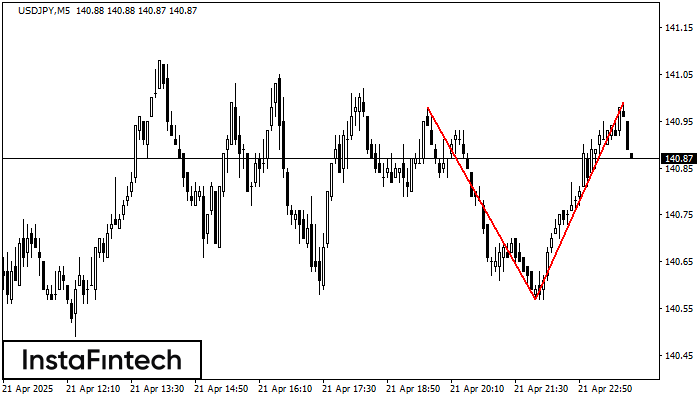
The Double Top reversal pattern has been formed on USDJPY M5. Characteristics: the upper boundary 140.98; the lower boundary 140.57; the width of the pattern is 42 points. Sell trades
The M5 and M15 time frames may have more false entry points.
Open chart in a new window
According to the chart of M5, #Bitcoin formed the Bullish Symmetrical Triangle pattern, which signals the trend will continue. Description. The upper border of the pattern touches the coordinates 88419.31/87233.62
The M5 and M15 time frames may have more false entry points.
Open chart in a new window