signal strength 1 of 5
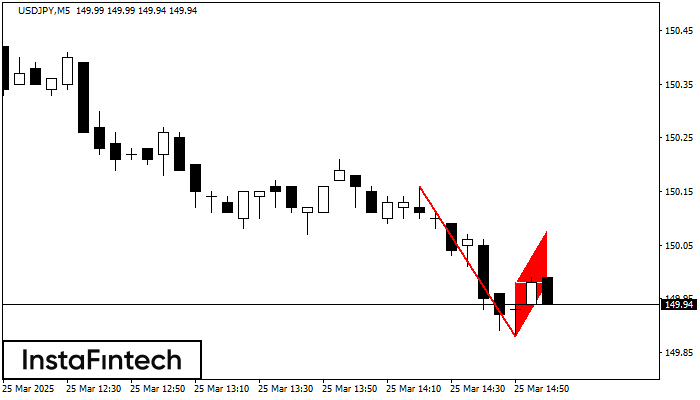
The Bearish Flag pattern has been formed on the chart USDJPY M5. Therefore, the downwards trend is likely to continue in the nearest term. As soon as the price breaks below the low at 149.88, traders should enter the market.
The M5 and M15 time frames may have more false entry points.
See Also
- All
- Double Top
- Flag
- Head and Shoulders
- Pennant
- Rectangle
- Triangle
- Triple top
- All
- #AAPL
- #AMZN
- #Bitcoin
- #EBAY
- #FB
- #GOOG
- #INTC
- #KO
- #MA
- #MCD
- #MSFT
- #NTDOY
- #PEP
- #TSLA
- #TWTR
- AUDCAD
- AUDCHF
- AUDJPY
- AUDUSD
- EURCAD
- EURCHF
- EURGBP
- EURJPY
- EURNZD
- EURRUB
- EURUSD
- GBPAUD
- GBPCHF
- GBPJPY
- GBPUSD
- GOLD
- NZDCAD
- NZDCHF
- NZDJPY
- NZDUSD
- SILVER
- USDCAD
- USDCHF
- USDJPY
- USDRUB
- All
- M5
- M15
- M30
- H1
- D1
- All
- Buy
- Sale
- All
- 1
- 2
- 3
- 4
- 5

The Double Bottom pattern has been formed on USDCAD M15; the upper boundary is 1.3801; the lower boundary is 1.3791. The width of the pattern is 11 points. In case
The M5 and M15 time frames may have more false entry points.
Open chart in a new window
The Bullish pennant signal – Trading instrument NZDCAD M5, continuation pattern. Forecast: it is possible to set up a buy position above the pattern’s high of 0.8304, with the prospect
The M5 and M15 time frames may have more false entry points.
Open chart in a new window
The Bullish pennant graphic pattern has formed on the NZDUSD M5 instrument. This pattern type falls under the category of continuation patterns. In this case, if the quote can breaks
The M5 and M15 time frames may have more false entry points.
Open chart in a new window