signal strength 2 of 5

According to the chart of M15, #MA formed the Bearish Symmetrical Triangle pattern. Description: The lower border is 466.76/487.62 and upper border is 503.68/487.62. The pattern width is measured on the chart at -3692 pips. The formation of the Bearish Symmetrical Triangle pattern evidently signals a continuation of the downward trend. In other words, if the scenario comes true and #MA breaches the lower border, the price could continue its move toward 487.39.
The M5 and M15 time frames may have more false entry points.
- All
- Double Top
- Flag
- Head and Shoulders
- Pennant
- Rectangle
- Triangle
- Triple top
- All
- #AAPL
- #AMZN
- #Bitcoin
- #EBAY
- #FB
- #GOOG
- #INTC
- #KO
- #MA
- #MCD
- #MSFT
- #NTDOY
- #PEP
- #TSLA
- #TWTR
- AUDCAD
- AUDCHF
- AUDJPY
- AUDUSD
- EURCAD
- EURCHF
- EURGBP
- EURJPY
- EURNZD
- EURRUB
- EURUSD
- GBPAUD
- GBPCHF
- GBPJPY
- GBPUSD
- GOLD
- NZDCAD
- NZDCHF
- NZDJPY
- NZDUSD
- SILVER
- USDCAD
- USDCHF
- USDJPY
- USDRUB
- All
- M5
- M15
- M30
- H1
- D1
- All
- Buy
- Sale
- All
- 1
- 2
- 3
- 4
- 5
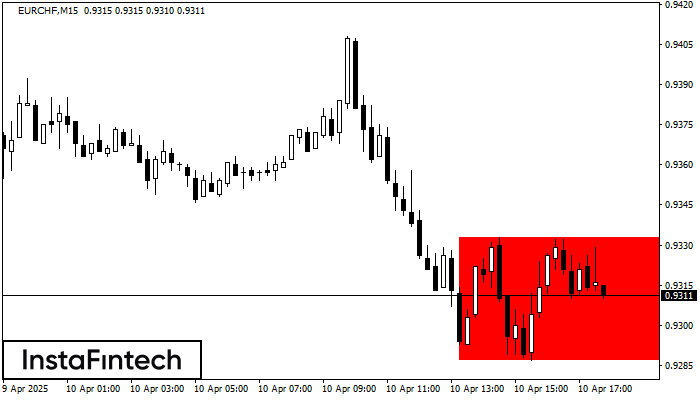
Berdasarkan carta M15, EURCHF telah membentuk Segi Empat Menurun yang merupakan corak kesinambungan aliran. Corak terkandung dalam sempadan berikut: sempadan bawah 0.9287 – 0.9287 dan sempadan atas 0.9333 – 0.9333
Carta masa M5 dan M15 mungkin mempunyai lebih banyak titik kemasukan palsu.
Open chart in a new window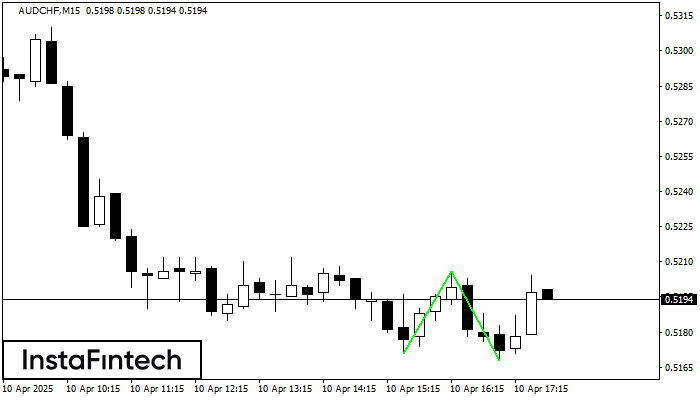
Corak Double Bottom telah dibentuk pada AUDCHF M15; sempadan atas adalah 0.5206; sempadan bawah adalah 0.5168. Lebar corak adalah 35 mata. Sekiranya penembusan sempadan atas 0.5206, perubahan aliran boleh diramalkan
Carta masa M5 dan M15 mungkin mempunyai lebih banyak titik kemasukan palsu.
Open chart in a new window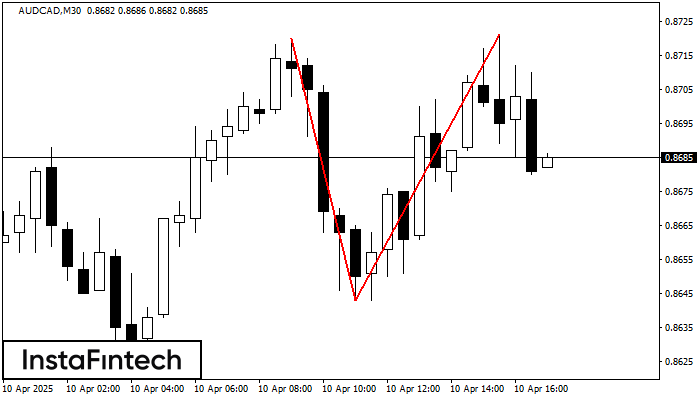
Pada carta AUDCAD M30 corak pembalikan Double Top telah terbentuk. Ciri-ciri: sempadan atas 0.8721; sempadan bawah 0.8643; lebar corak 78 mata. Isyarat: penembusan sempadan bawah akan menyebabkan kesinambungan arah aliran
Open chart in a new window