empty
24.11.2023 08:15 PM
Technical analysis on USD/CAD on November 24, 2023

This image is no longer relevant

Overview :

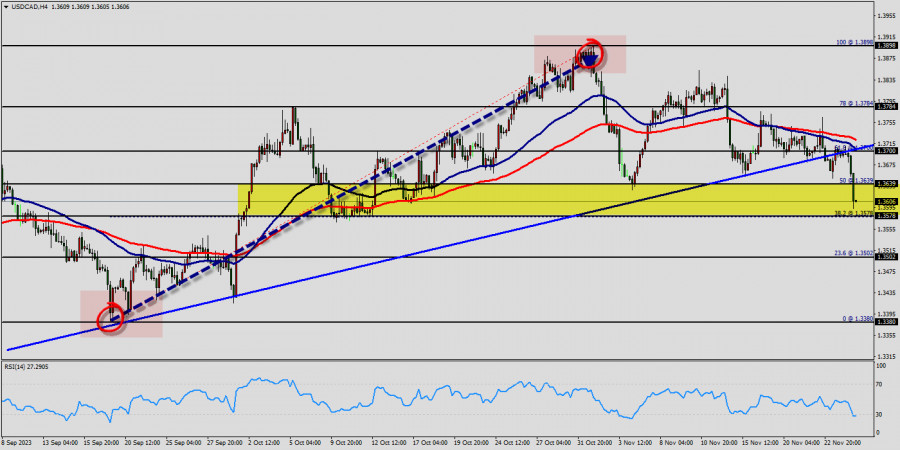
The USD/CAD pair broke resistance which turned to strong support at the level of 1.3578 yesterday. The level of 1.3578 coincides with a golden ratio (38.2% of Fibonacci), which is expected to act as major support today. The Relative Strength Index (RSI) is considered overbought because it is above 30. The RSI is still signaling that the trend is upward as it is still strong above the moving average (100).

The USD/CAD pair is continuing in a bullish market from the support levels of 1.3502 and 1.3578. Also, it should be noted that the current price is in a bullish channel. Equally important, the RSI is still signaling that the trend is upward as it is still strong above the moving average (100) since yesterday.

Immediate support is seen at 1.3578 which coincides with a golden ratio (38.2% of Fibonacci). Consequently, the first support sets at the level of 1.3578. So, the market is likely to show signs of a bullish trend around the spot of 1.3578/1.3502. It is also worth noting that the price at 1.3502 will possibly form a strong support.

This suggests the pair will probably go up in coming hours. Accordingly, the market is likely to show signs of a bullish trend. The level of 1.3784 will act as strong resistance and the double top is already set at the point of 1.3898.

In other words, buy orders are recommended above 1.3578 with the first target at the level of 1.3639. From this point, the pair is likely to begin an ascending movement to the point of 1.3700 and further to the level of 1.3784.

On the other hand, if a breakout happens at the support level of 1.3502, then this scenario may become invalidated.

Forecast :

According to the previous events, the USD/CAD pair is still moving between the levels of 1.3502 and 1.3784; for that we expect a range of 282 pips (1.3784 - 1.3502) in coming days.

If the USD/CAD pair fails to break through the resistance level of 1.3700, the market will decline further to 1.3502. This would suggest a bearish market because the RSI indicator is still in a positive area and does not show any trend-reversal signs. The pair is expected to drop lower towards at least 1.3308 with a view to test the daily pivot point.

Pilih carta masa
5
min
15
min
30
min
1
jam
4
jam
1
hari
1
minggu
Jana pendapatan melalui perubahan kadar mata wang kripto dengan InstaForex.
Muat turun MetaTrader 4 dan buka dagangan pertama anda.
  • Grand Choice
    Contest by
    InstaForex
    InstaForex always strives to help you
    fulfill your biggest dreams.
    SERTAI PERADUAN

Artikel yang dicadangkan

Analisis Teknikal Pergerakan Harga Intraday Pasangan Mata Wang Utama USD/JPY, Rabu 30 April 2025.

Pada carta 4 jam pasangan mata wang utama USD/JPY, dapat dilihat bahawa penunjuk Pengayun Stochastic membentuk corak Gandaan Bawah (Double Bottom) manakala pergerakan harga USD/JPY membentuk corak Higher High, justeru

Arief Makmur 06:17 2025-04-30 UTC+2

Isyarat Dagangan untuk EUR/USD bagi 28-30 April 2025: jual di bawah 1.1370 (21 SMA - 7/8 Murray)

Sebaliknya, jika tekanan penurunan berterusan dan euro mengukuh di bawah 1.1370, ia boleh dianggap sebagai isyarat jual dengan sasaran pada 6/8 Murray terletak pada 1.1230 dan akhirnya di bahagian bawah

Dimitrios Zappas 16:29 2025-04-28 UTC+2

Isyarat Dagangan EMAS (XAU/USD) untuk 28-30 April 2025: beli melebihi $3,270 (21 SMA - 7/8 Murray)

Pada awal sesi dagangan Amerika, emas didagangkan sekitar paras 3,299 dalam saluran aliran menurun yang terbentuk sejak 21 April, menunjukkan pemulihan di atas sokongan pada paras 3,270. Pada carta

Dimitrios Zappas 16:25 2025-04-28 UTC+2

GOLD – Tinjauan Analisis Teknikal

Minggu lepas, 'kenaikan harga' telah mengemaskini rekod tertinggi dan membentuk maksimum ekstrem yang baru pada 3499.58. Selepas itu, emas memasuki pembetulan ke bawah menuju sokongan aliran jangka pendek harian pada

Evangelos Poulakis 06:49 2025-04-28 UTC+2

USD/JPY – Ringkasan dan Prospek

Minggu lepas, pasaran mencatat paras terendah baru, tetapi penjual gagal meneruskan pergerakan turun sepenuhnya. Ini mungkin terjadi kerana paras terendah minggu sebelumnya (141.63) disokong oleh paras sokongan bulanan (141.96). Akibatnya

Evangelos Poulakis 03:51 2025-04-28 UTC+2

Isyarat Dagangan untuk EMAS (XAU/USD) bagi 25-29 April, 2025: beli di atas $3,270 (21 SMA - pantulan semula)

Pada awal sesi Amerika, emas sedang didagangkan sekitar 3,276 dengan tekanan menurun selepas mengalami rintangan kuat sekitar 3,270, tahap yang bertepatan dengan penarikan semula Fibonacci 38.2%. Emas kini mungkin mencapai

Dimitrios Zappas 18:02 2025-04-25 UTC+2

Isyarat Dagangan EUR/USD untuk 24-26 April 2025: jual di bawah 1.1435 (21 SMA - 7/8 Murray)

Pada awal sesi dagangan Amerika, pasangan EUR/USD didagangkan sekitar paras 1.1358 dalam saluran menurun yang terbentuk sejak 18 April. Pasangan ini masih berada di bawah tekanan menurun. Kami berpendapat instrumen

Dimitrios Zappas 17:06 2025-04-24 UTC+2

EMAS. Harga Emas Berkemungkinan Menyusut Dengan Ketara Dalam Masa Terdekat

Harga emas baru-baru ini mengalami pembetulan yang ketara berikutan jangkaan pasaran terhadap permulaan rundingan sebenar antara Amerika Syarikat dan China berhubung tarif serta perdagangan secara keseluruhan. Kenyataan Setiausaha Perbendaharaan

Pati Gani 09:38 2025-04-24 UTC+2

Analisis Teknikal Pergerakan Harga Instrumen Komoditi Perak, Khamis 24 April 2025.

Pada carta 4 jam, instrumen komoditi Silver kelihatan meskipun keadaannya mengukuh di mana ini disahkan oleh pergerakan harga Silver yang bergerak di atas WMA (30 Shift 2) yang juga mempunyai

Arief Makmur 06:18 2025-04-24 UTC+2

Analisis Teknikal Pergerakan Harga Indeks Nasdaq 100, Khamis 24 April 2025.

Walaupun pada carta 4 jam indeks Nasdaq 100 berada dalam keadaan mendatar (Sideways), julat pergerakannya masih cukup luas, sekali gus menawarkan peluang yang agak menarik pada indeks ini. Ketika

Arief Makmur 06:18 2025-04-24 UTC+2
Tidak boleh bertanya sekarang?
Tanya soalan anda di Ruangan bersembang.
Panggilan semula Widget
 

Dear visitor,

Your IP address shows that you are currently located in the USA. If you are a resident of the United States, you are prohibited from using the services of InstaFintech Group including online trading, online transfers, deposit/withdrawal of funds, etc.

If you think you are seeing this message by mistake and your location is not the US, kindly proceed to the website. Otherwise, you must leave the website in order to comply with government restrictions.

Why does your IP address show your location as the USA?

  • - you are using a VPN provided by a hosting company based in the United States;
  • - your IP does not have proper WHOIS records;
  • - an error occurred in the WHOIS geolocation database.

Please confirm whether you are a US resident or not by clicking the relevant button below. If you choose the wrong option, being a US resident, you will not be able to open an account with InstaForex anyway.

We are sorry for any inconvenience caused by this message.