

signal strength 1 of 5
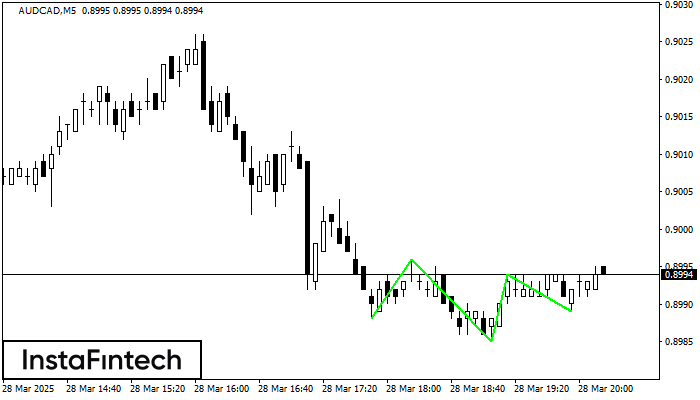
According to the chart of M5, AUDCAD produced the pattern termed the Inverse Head and Shoulder. The Head is fixed at 0.8985 while the median line of the Neck is set at 0.8996/0.8994. The formation of the Inverse Head and Shoulder Pattern clearly indicates a reversal of the downward trend. In means that in case the scenario comes true, the price of AUDCAD will go towards 0.9009.
The M5 and M15 time frames may have more false entry points.
- All
- Double Top
- Flag
- Head and Shoulders
- Pennant
- Rectangle
- Triangle
- Triple top
- All
- #AAPL
- #AMZN
- #Bitcoin
- #EBAY
- #FB
- #GOOG
- #INTC
- #KO
- #MA
- #MCD
- #MSFT
- #NTDOY
- #PEP
- #TSLA
- #TWTR
- AUDCAD
- AUDCHF
- AUDJPY
- AUDUSD
- EURCAD
- EURCHF
- EURGBP
- EURJPY
- EURNZD
- EURRUB
- EURUSD
- GBPAUD
- GBPCHF
- GBPJPY
- GBPUSD
- GOLD
- NZDCAD
- NZDCHF
- NZDJPY
- NZDUSD
- SILVER
- USDCAD
- USDCHF
- USDJPY
- USDRUB
- All
- M5
- M15
- M30
- H1
- D1
- All
- Buy
- Sale
- All
- 1
- 2
- 3
- 4
- 5
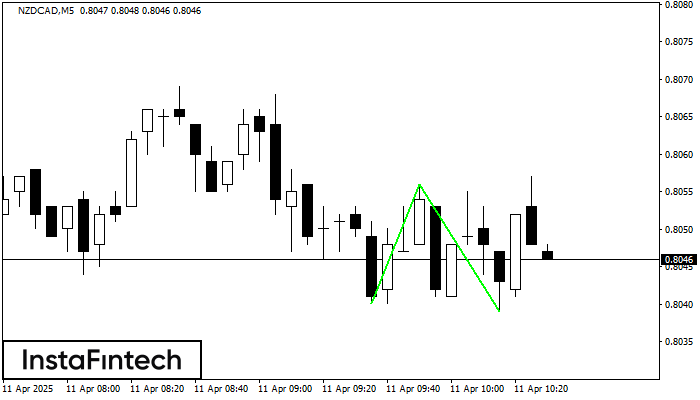
O padrão Fundo duplo foi formado em NZDCAD M5. Características: o nível de suporte 0.8040; o nível de resistência 0.8056; a largura do padrão 16 pontos. Se o nível
Os intervalos M5 e M15 podem ter mais pontos de entrada falsos.
Open chart in a new window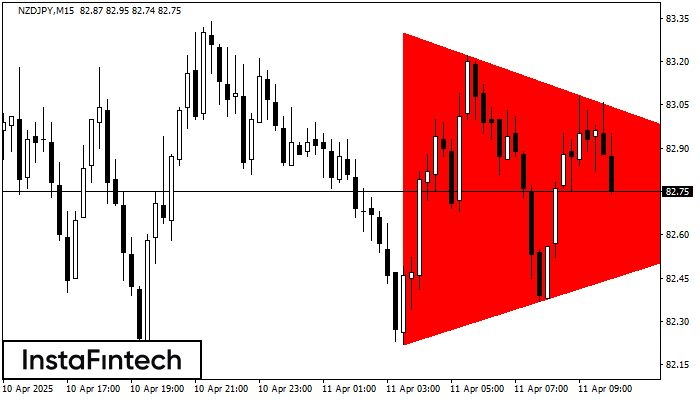
De acordo com o gráfico de M15, NZDJPY fomrou o padrão de Triângulo Simétrico de Baixa. Este padrão sinaliza uma nova tendência de baixa se o limite inferior 82.22
Os intervalos M5 e M15 podem ter mais pontos de entrada falsos.
Open chart in a new window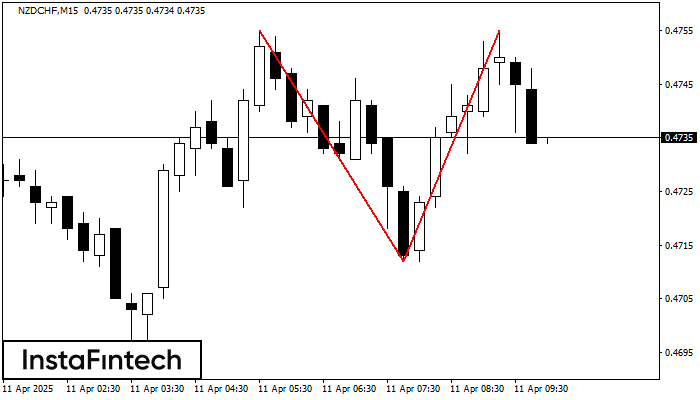
No gráfico de NZDCHF M15 o padrão de reversão Topo duplo foi formado. Características: o limite superior 0.4755; o limite inferior 0.4712; a largura do padrão 43 pontos. O sinal
Os intervalos M5 e M15 podem ter mais pontos de entrada falsos.
Open chart in a new window


