signal strength 3 of 5

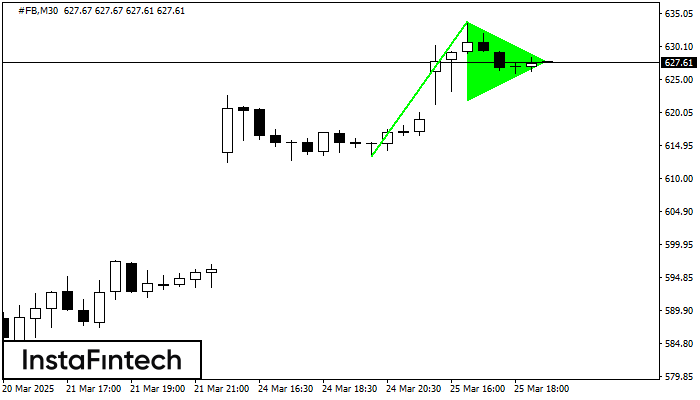
The Bullish pennant pattern is formed on the #FB M30 chart. It is a type of the continuation pattern. Supposedly, in case the price is fixed above the pennant’s high of 633.82, a further uptrend is possible.
See Also
- All
- Double Top
- Flag
- Head and Shoulders
- Pennant
- Rectangle
- Triangle
- Triple top
- All
- #AAPL
- #AMZN
- #Bitcoin
- #EBAY
- #FB
- #GOOG
- #INTC
- #KO
- #MA
- #MCD
- #MSFT
- #NTDOY
- #PEP
- #TSLA
- #TWTR
- AUDCAD
- AUDCHF
- AUDJPY
- AUDUSD
- EURCAD
- EURCHF
- EURGBP
- EURJPY
- EURNZD
- EURRUB
- EURUSD
- GBPAUD
- GBPCHF
- GBPJPY
- GBPUSD
- GOLD
- NZDCAD
- NZDCHF
- NZDJPY
- NZDUSD
- SILVER
- USDCAD
- USDCHF
- USDJPY
- USDRUB
- All
- M5
- M15
- M30
- H1
- D1
- All
- Buy
- Sale
- All
- 1
- 2
- 3
- 4
- 5
The Triple Top pattern has formed on the chart of the EURGBP M15. Features of the pattern: borders have an ascending angle; the lower line of the pattern
The M5 and M15 time frames may have more false entry points.
Open chart in a new windowThe Bearish pennant pattern has formed on the AUDCHF M5 chart. The pattern signals continuation of the downtrend in case the pennant’s low of 0.5526 is broken through. Recommendations: Place
The M5 and M15 time frames may have more false entry points.
Open chart in a new windowThe Double Top pattern has been formed on EURCAD M15. It signals that the trend has been changed from upwards to downwards. Probably, if the base of the pattern 1.5459
The M5 and M15 time frames may have more false entry points.
Open chart in a new window