In my morning forecast, I focused on the 1.0450 level as a key area for making entry decisions. Reviewing the 5-minute chart, the price declined but fell short of testing and formed a false breakout around 1.0450 by just a couple of points, leaving me without a buy position. Similarly, selling from 1.0485 yielded no results as the euro continued its upward movement. For the second half of the day, the technical outlook has been revised.
For Long Positions on EUR/USD
Positive data from Germany's IFO index helped restore confidence among euro buyers, who had been under pressure during the Asian session. Consequently, the EUR/USD pair erased all losses and is now targeting a new weekly high. Later in the day, we will see important US data on new home sales, which could put pressure back on the euro if the figures exceed economists' expectations.
In case of a bearish reaction and a price drop, I plan to act near the new support at 1.0490, formed during the first half of the day. A false breakout at this level would provide a good entry point for buying, aiming for resistance at 1.0531. A breakout and retest of this range, combined with weak US data, would confirm the buying scenario, targeting 1.0567. The furthest target would be the 1.0593 level, where I plan to take profits.
If EUR/USD declines and there is no activity around 1.0490, the pair risks getting stuck in a sideways channel until the Federal Reserve meeting on Wednesday. In such a case, sellers may push the price down to 1.0453. Only after a false breakout there will I consider buying the euro. Alternatively, I will open long positions on a bounce from 1.0415, aiming for a 30–35 pip upward correction within the day.
For Short Positions on EUR/USD
Sellers made attempts earlier but seem to have exhausted their strength, as buyers quickly recovered all losses. Now, hopes rest on strong US data, particularly from the housing market.
The primary target for bears in the second half of the day will be to defend the new resistance at 1.0531. A false breakout at this level would confirm the return of large sellers, providing an entry point for shorts, with the aim of pulling the price down to the 1.0490 support, where the moving averages favor the bulls. A breakout and retest of this range from below could lead to further declines toward 1.0453, with the final target being the 1.0415 level, where I plan to take profits.
If EUR/USD continues to rise in the second half of the day without significant seller activity at 1.0531, I will postpone short positions until the next resistance at 1.0567. Shorts will only be considered after a failed consolidation at this level. Alternatively, I plan to sell on a rebound from 1.0593, aiming for a 30–35 point downward correction.
COT Report (Commitments of Traders)
The latest COT report from January 14 showed a reduction in both long and short positions. As uncertainty surrounding the Federal Reserve's future policy grows, traders reduced their holdings. The inauguration of Donald Trump added some pessimism, but the overall balance of power remained largely unchanged. Long non-commercial positions decreased by 3,743 to 162,760, while short non-commercial positions fell by 7,470 to 223,157, widening the gap between long and short positions by 3,096.
Indicator Signals
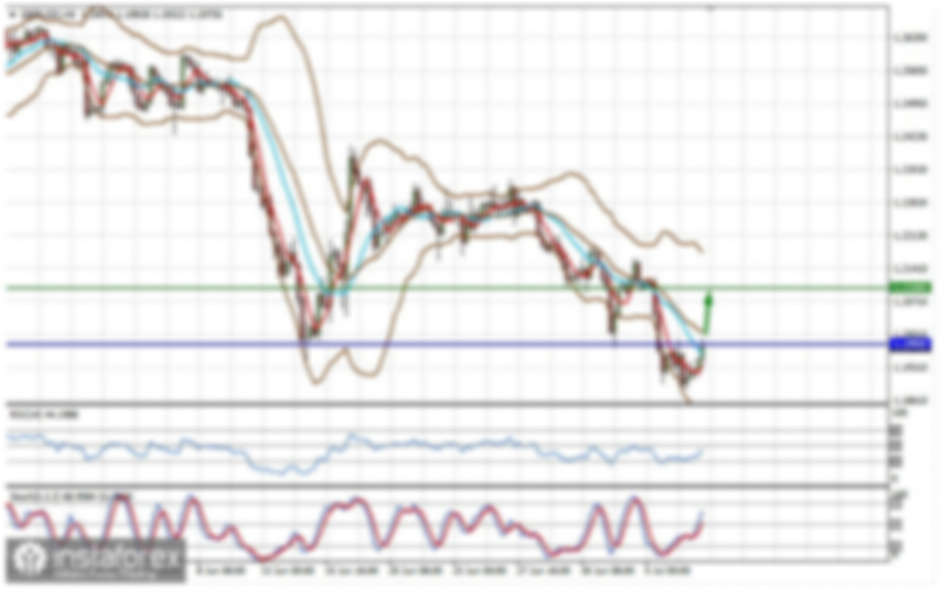
Moving Averages
Trading is above the 30-day and 50-day moving averages, indicating further potential for euro growth.
Note: The author analyzes moving averages on the H1 chart, which may differ from classical daily averages on the D1 chart.
Bollinger Bands
In case of a decline, the lower boundary of the indicator near 1.0453 will act as support.
Indicator Descriptions
- Moving Average (MA): Smooths volatility and noise to define the current trend. Periods used: 50 (yellow line) and 30 (green line).
- MACD: Tracks convergence/divergence of moving averages (Fast EMA: 12, Slow EMA: 26, SMA: 9).
- Bollinger Bands: Used to identify volatility and overbought/oversold levels (Period: 20).
- Non-commercial traders: Speculators like individual traders, hedge funds, and large institutions trading futures for speculative purposes.
- Long non-commercial positions: Total long open positions held by non-commercial traders.
- Short non-commercial positions: Total short open positions held by non-commercial traders.
- Net non-commercial position: The difference between short and long positions held by non-commercial traders.