signal strength 1 of 5

The Bearish pennant pattern has formed on the AUDCAD M5 chart. It signals potential continuation of the existing trend. Specifications: the pattern’s bottom has the coordinate of 0.8881; the projection of the flagpole height is equal to 21 pips. In case the price breaks out the pattern’s bottom of 0.8881, the downtrend is expected to continue for further level 0.8866.
The M5 and M15 time frames may have more false entry points.
See Also
- All
- Double Top
- Flag
- Head and Shoulders
- Pennant
- Rectangle
- Triangle
- Triple top
- All
- #AAPL
- #AMZN
- #Bitcoin
- #EBAY
- #FB
- #GOOG
- #INTC
- #KO
- #MA
- #MCD
- #MSFT
- #NTDOY
- #PEP
- #TSLA
- #TWTR
- AUDCAD
- AUDCHF
- AUDJPY
- AUDUSD
- EURCAD
- EURCHF
- EURGBP
- EURJPY
- EURNZD
- EURRUB
- EURUSD
- GBPAUD
- GBPCHF
- GBPJPY
- GBPUSD
- GOLD
- NZDCAD
- NZDCHF
- NZDJPY
- NZDUSD
- SILVER
- USDCAD
- USDCHF
- USDJPY
- USDRUB
- All
- M5
- M15
- M30
- H1
- D1
- All
- Buy
- Sale
- All
- 1
- 2
- 3
- 4
- 5
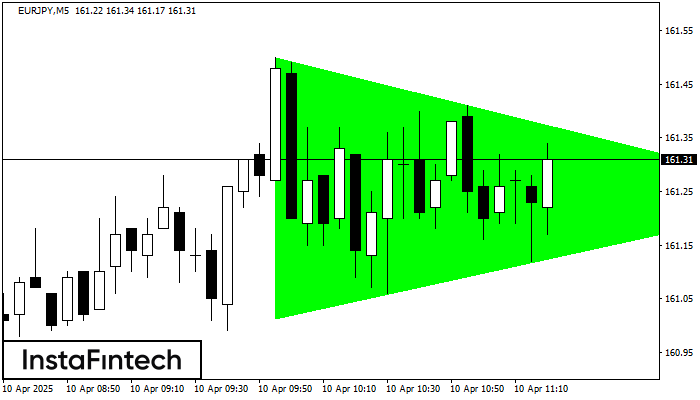
According to the chart of M5, EURJPY formed the Bullish Symmetrical Triangle pattern, which signals the trend will continue. Description. The upper border of the pattern touches the coordinates 161.50/161.24
The M5 and M15 time frames may have more false entry points.
Open chart in a new window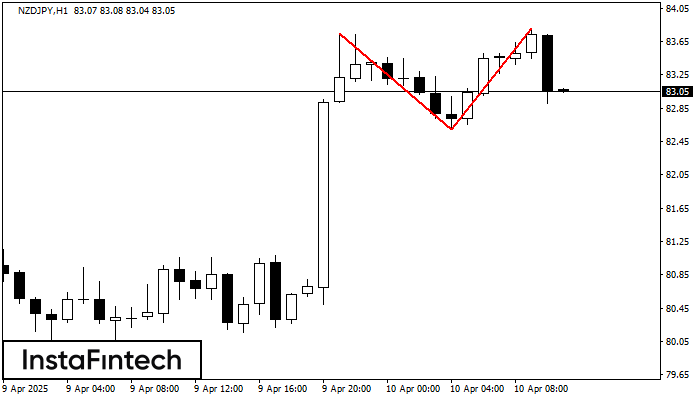
On the chart of NZDJPY H1 the Double Top reversal pattern has been formed. Characteristics: the upper boundary 83.80; the lower boundary 82.60; the width of the pattern 120 points
Open chart in a new window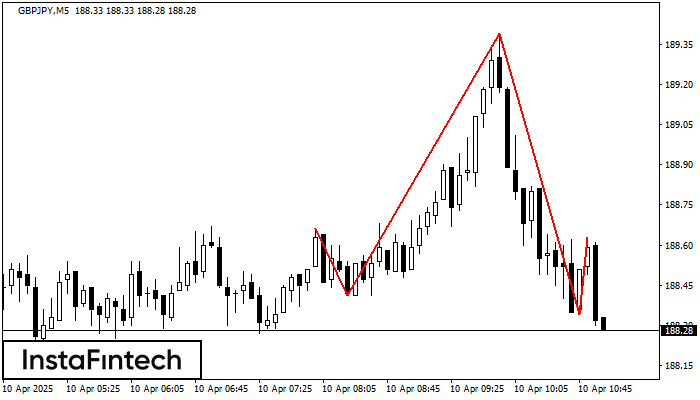
The GBPJPY M5 formed the Head and Shoulders pattern with the following features: The Head’s top is at 189.39, the Neckline and the upward angle are at 188.41/188.34. The formation
The M5 and M15 time frames may have more false entry points.
Open chart in a new window