signal strength 2 of 5
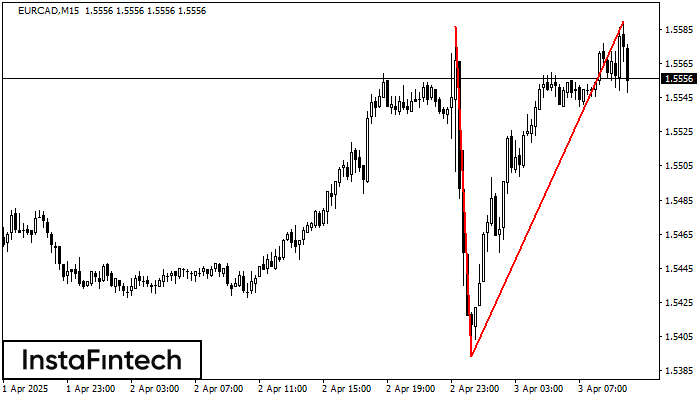
The Double Top reversal pattern has been formed on EURCAD M15. Characteristics: the upper boundary 1.5587; the lower boundary 1.5393; the width of the pattern is 197 points. Sell trades are better to be opened below the lower boundary 1.5393 with a possible movements towards the 1.5371 level.
The M5 and M15 time frames may have more false entry points.
- All
- Double Top
- Flag
- Head and Shoulders
- Pennant
- Rectangle
- Triangle
- Triple top
- All
- #AAPL
- #AMZN
- #Bitcoin
- #EBAY
- #FB
- #GOOG
- #INTC
- #KO
- #MA
- #MCD
- #MSFT
- #NTDOY
- #PEP
- #TSLA
- #TWTR
- AUDCAD
- AUDCHF
- AUDJPY
- AUDUSD
- EURCAD
- EURCHF
- EURGBP
- EURJPY
- EURNZD
- EURRUB
- EURUSD
- GBPAUD
- GBPCHF
- GBPJPY
- GBPUSD
- GOLD
- NZDCAD
- NZDCHF
- NZDJPY
- NZDUSD
- SILVER
- USDCAD
- USDCHF
- USDJPY
- USDRUB
- All
- M5
- M15
- M30
- H1
- D1
- All
- Buy
- Sale
- All
- 1
- 2
- 3
- 4
- 5
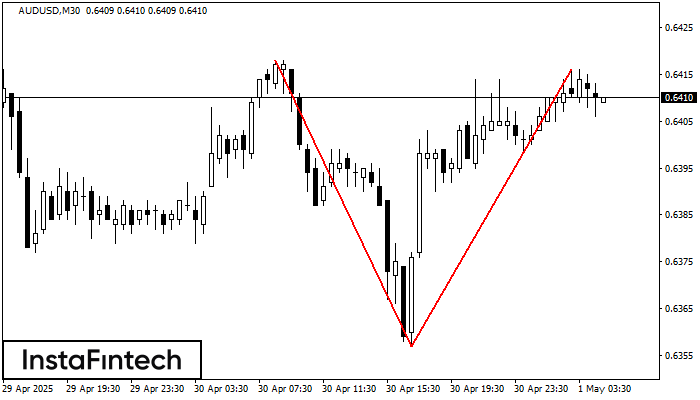
The Double Top reversal pattern has been formed on AUDUSD M30. Characteristics: the upper boundary 0.6418; the lower boundary 0.6357; the width of the pattern is 59 points. Sell trades
Открыть график инструмента в новом окне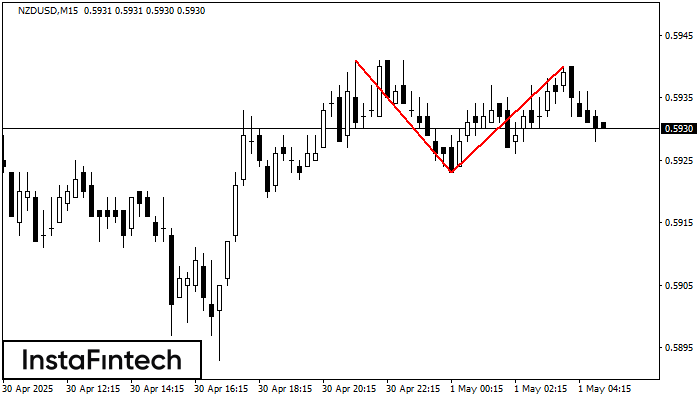
The Double Top pattern has been formed on NZDUSD M15. It signals that the trend has been changed from upwards to downwards. Probably, if the base of the pattern 0.5923
The M5 and M15 time frames may have more false entry points.
Открыть график инструмента в новом окне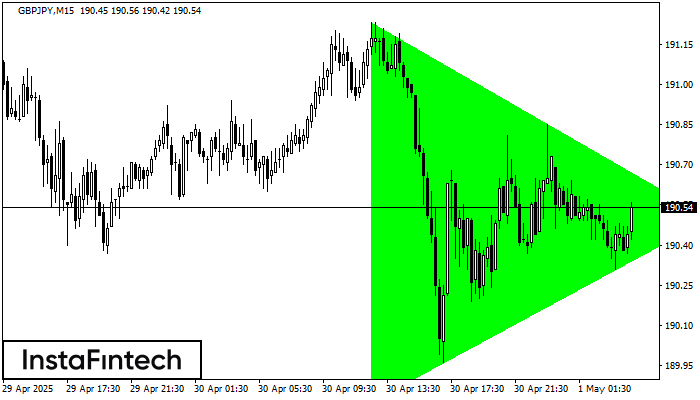
According to the chart of M15, GBPJPY formed the Bullish Symmetrical Triangle pattern, which signals the trend will continue. Description. The upper border of the pattern touches the coordinates 191.23/190.50
The M5 and M15 time frames may have more false entry points.
Открыть график инструмента в новом окне