signal strength 1 of 5

The Triple Top pattern has formed on the chart of the #Bitcoin M5 trading instrument. It is a reversal pattern featuring the following characteristics: resistance level 50, support level -21012, and pattern’s width 47477. Forecast If the price breaks through the support level 82165.38, it is likely to move further down to 82748.85.
The M5 and M15 time frames may have more false entry points.
See Also
- All
- Double Top
- Flag
- Head and Shoulders
- Pennant
- Rectangle
- Triangle
- Triple top
- All
- #AAPL
- #AMZN
- #Bitcoin
- #EBAY
- #FB
- #GOOG
- #INTC
- #KO
- #MA
- #MCD
- #MSFT
- #NTDOY
- #PEP
- #TSLA
- #TWTR
- AUDCAD
- AUDCHF
- AUDJPY
- AUDUSD
- EURCAD
- EURCHF
- EURGBP
- EURJPY
- EURNZD
- EURRUB
- EURUSD
- GBPAUD
- GBPCHF
- GBPJPY
- GBPUSD
- GOLD
- NZDCAD
- NZDCHF
- NZDJPY
- NZDUSD
- SILVER
- USDCAD
- USDCHF
- USDJPY
- USDRUB
- All
- M5
- M15
- M30
- H1
- D1
- All
- Buy
- Sale
- All
- 1
- 2
- 3
- 4
- 5
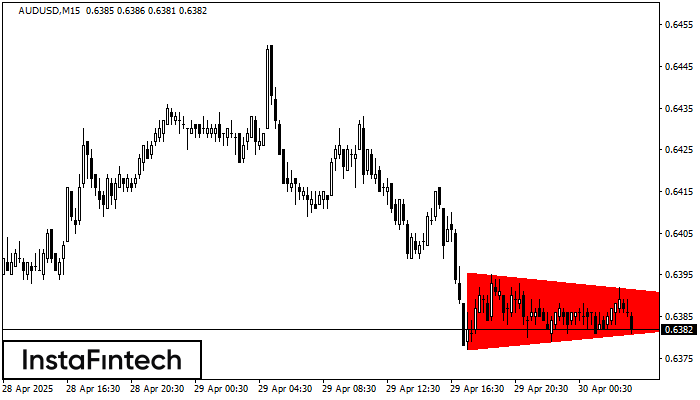
According to the chart of M15, AUDUSD formed the Bearish Symmetrical Triangle pattern. Description: The lower border is 0.6377/0.6386 and upper border is 0.6396/0.6386. The pattern width is measured
The M5 and M15 time frames may have more false entry points.
Открыть график инструмента в новом окне
The Bearish Flag pattern has been formed on the chart NZDCAD H1 which signals that the downward trend will continue. If the price breaks below the low at 0.8194, then
Открыть график инструмента в новом окне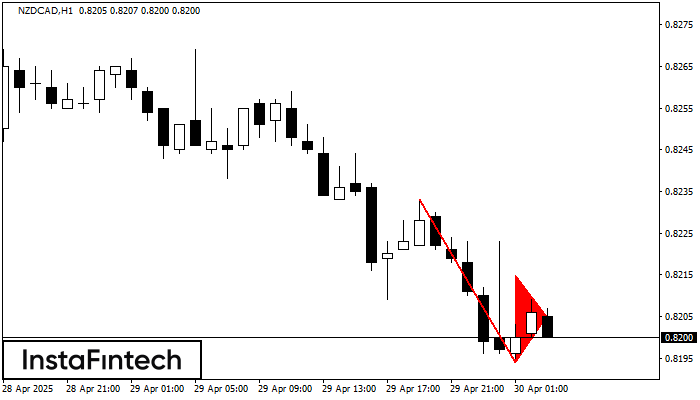
The Bearish pennant pattern has formed on the NZDCAD H1 chart. The pattern signals continuation of the downtrend in case the pennant’s low of 0.8194 is broken through. Recommendations: Place
Открыть график инструмента в новом окне