signal strength 3 of 5
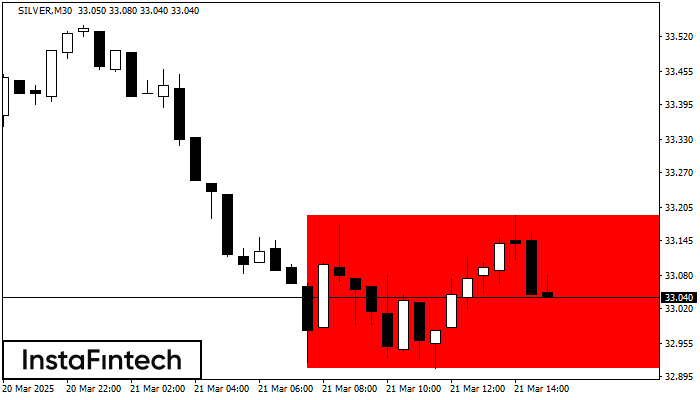
According to the chart of M30, SILVER formed the Bearish Rectangle. The pattern indicates a trend continuation. The upper border is 33.19, the lower border is 32.91. The signal means that a short position should be opened after fixing a price below the lower border 32.91 of the Bearish Rectangle.
- All
- Double Top
- Flag
- Head and Shoulders
- Pennant
- Rectangle
- Triangle
- Triple top
- All
- #AAPL
- #AMZN
- #Bitcoin
- #EBAY
- #FB
- #GOOG
- #INTC
- #KO
- #MA
- #MCD
- #MSFT
- #NTDOY
- #PEP
- #TSLA
- #TWTR
- AUDCAD
- AUDCHF
- AUDJPY
- AUDUSD
- EURCAD
- EURCHF
- EURGBP
- EURJPY
- EURNZD
- EURRUB
- EURUSD
- GBPAUD
- GBPCHF
- GBPJPY
- GBPUSD
- GOLD
- NZDCAD
- NZDCHF
- NZDJPY
- NZDUSD
- SILVER
- USDCAD
- USDCHF
- USDJPY
- USDRUB
- All
- M5
- M15
- M30
- H1
- D1
- All
- Buy
- Sale
- All
- 1
- 2
- 3
- 4
- 5
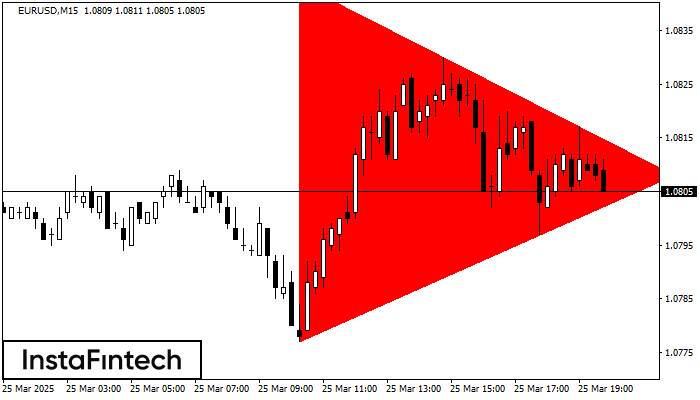
According to the chart of M15, EURUSD formed the Bearish Symmetrical Triangle pattern. Trading recommendations: A breach of the lower border 1.0777 is likely to encourage a continuation
The M5 and M15 time frames may have more false entry points.
Open chart in a new window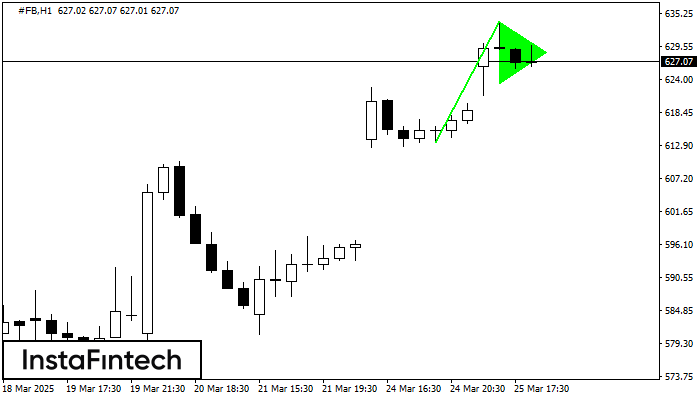
The Bullish pennant graphic pattern has formed on the #FB H1 instrument. This pattern type falls under the category of continuation patterns. In this case, if the quote can breaks
Open chart in a new window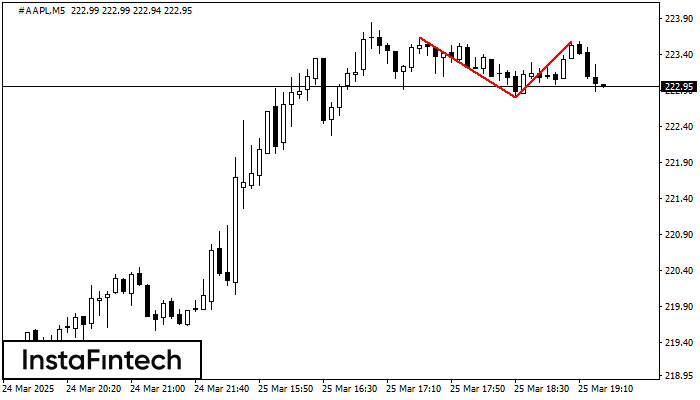
On the chart of #AAPL M5 the Double Top reversal pattern has been formed. Characteristics: the upper boundary 223.58; the lower boundary 222.80; the width of the pattern 78 points
The M5 and M15 time frames may have more false entry points.
Open chart in a new window