signal strength 4 of 5

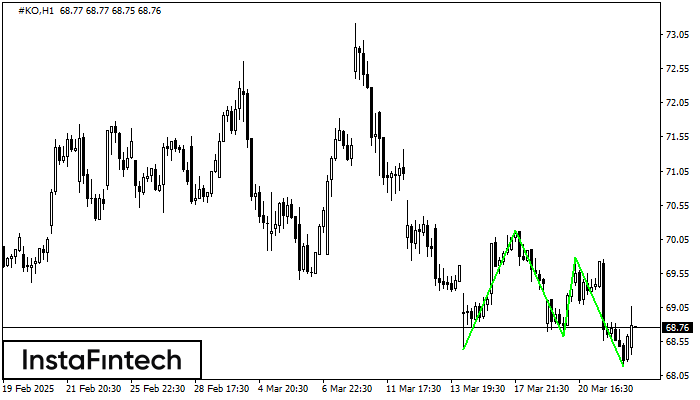
The Triple Bottom pattern has formed on the chart of #KO H1. Features of the pattern: The lower line of the pattern has coordinates 70.18 with the upper limit 70.18/69.78, the projection of the width is 175 points. The formation of the Triple Bottom pattern most likely indicates a change in the trend from downward to upward. This means that in the event of a breakdown of the resistance level 68.43, the price is most likely to continue the upward movement.
انظر أيضا
- All
- Double Top
- Flag
- Head and Shoulders
- Pennant
- Rectangle
- Triangle
- Triple top
- All
- #AAPL
- #AMZN
- #Bitcoin
- #EBAY
- #FB
- #GOOG
- #INTC
- #KO
- #MA
- #MCD
- #MSFT
- #NTDOY
- #PEP
- #TSLA
- #TWTR
- AUDCAD
- AUDCHF
- AUDJPY
- AUDUSD
- EURCAD
- EURCHF
- EURGBP
- EURJPY
- EURNZD
- EURRUB
- EURUSD
- GBPAUD
- GBPCHF
- GBPJPY
- GBPUSD
- GOLD
- NZDCAD
- NZDCHF
- NZDJPY
- NZDUSD
- SILVER
- USDCAD
- USDCHF
- USDJPY
- USDRUB
- All
- M5
- M15
- M30
- H1
- D1
- All
- Buy
- Sale
- All
- 1
- 2
- 3
- 4
- 5
The Bullish Flag pattern has been formed on the chart AUDUSD M15 which signals that the upward trend will continue. Signals: а break of the peak at 0.6302 may push
The M5 and M15 time frames may have more false entry points.
Open chart in a new windowAccording to the chart of M5, EURGBP formed the Bullish Rectangle. The pattern indicates a trend continuation. The upper border is 0.8356, the lower border is 0.8352. The signal means
The M5 and M15 time frames may have more false entry points.
Open chart in a new windowThe Double Top pattern has been formed on GBPJPY M15. It signals that the trend has been changed from upwards to downwards. Probably, if the base of the pattern 193.33
The M5 and M15 time frames may have more false entry points.
Open chart in a new window